Answered step by step
Verified Expert Solution
Question
1 Approved Answer
A firm is analyzing the relationship between advertising expense and sales in order to determine whether to increase or scale back on advertising in the
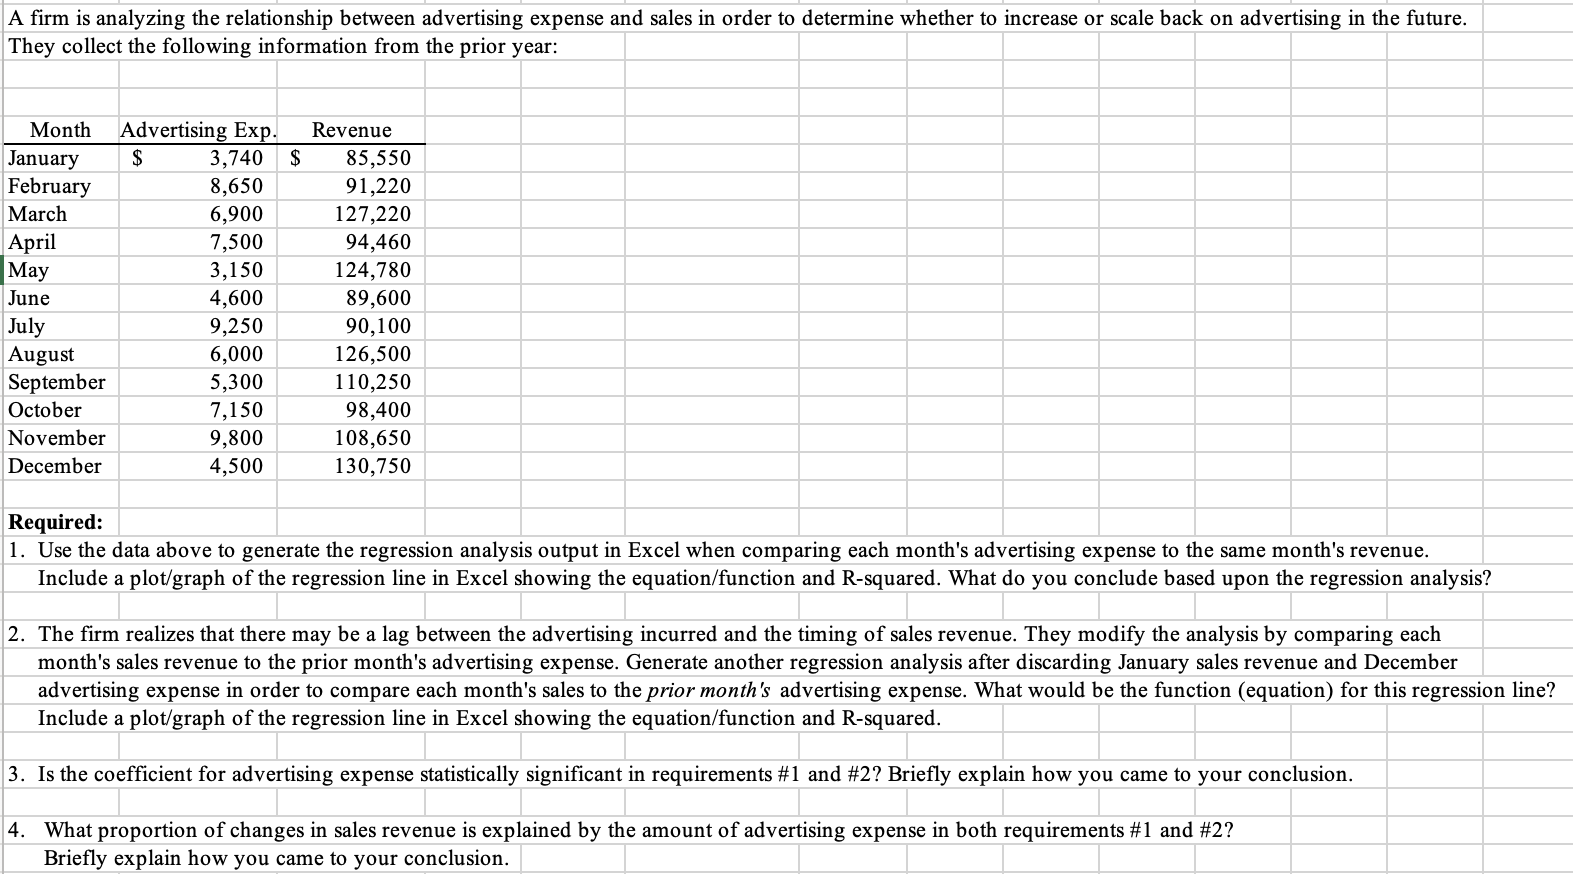
A firm is analyzing the relationship between advertising expense and sales in order to determine whether to increase or scale back on advertising in the future.
They collect the following information from the prior year:
Use the data above to generate the regression analysis output in Excel when comparing each month's advertising expense to the same month's revenue.
Include a plotgraph of the regression line in Excel showing the equationfunction and Rsquared. What do you conclude based upon the regression analysis?
The firm realizes that there may be a lag between the advertising incurred and the timing of sales revenue. They modify the analysis by comparing each
month's sales revenue to the prior month's advertising expense. Generate another regression analysis after discarding January sales revenue and December
advertising expense in order to compare each month's sales to the prior month's advertising expense. What would be the function equation for this regression line?
Include a plotgraph of the regression line in Excel showing the equationfunction and Rsquared.
Is the coefficient for advertising expense statistically significant in requirements # and # Briefly explain how you came to your conclusion.
What proportion of changes in sales revenue is explained by the amount of advertising expense in both requirements # and #
Briefly explain how you came to your conclusion.

Step by Step Solution
There are 3 Steps involved in it
Step: 1

Get Instant Access to Expert-Tailored Solutions
See step-by-step solutions with expert insights and AI powered tools for academic success
Step: 2

Step: 3

Ace Your Homework with AI
Get the answers you need in no time with our AI-driven, step-by-step assistance
Get Started


