Answered step by step
Verified Expert Solution
Question
1 Approved Answer
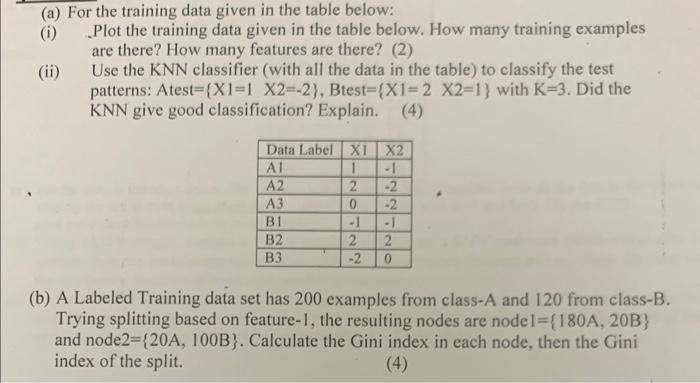
(a) For the training data given in the table below: (i) Plot the training data given in the table below. How many training examples

(a) For the training data given in the table below: (i) Plot the training data given in the table below. How many training examples are there? How many features are there? (2) (ii) Use the KNN classifier (with all the data in the table) to classify the test patterns: Atest={X1=1 X2=-2), Btest-{X1-2 X2-1} with K-3. Did the KNN give good classification? Explain. (4) Data Label X1 X2 AI 1 -1 A2 -2 A3 -2 B1 B2 B3 2 0 -1 2 -2 2 0 (b) A Labeled Training data set has 200 examples from class-A and 120 from class-B. Trying splitting based on feature-1, the resulting nodes are nodel={180A, 20B) and node2={20A, 100B}. Calculate the Gini index in each node, then the Gini index of the split. (4)
Step by Step Solution
★★★★★
3.38 Rating (154 Votes )
There are 3 Steps involved in it
Step: 1
Question a Plot the training data Use a suitable plotting library egMatplotlib in Python to create a scatter plot with X1 as the xaxis and X2 as the yaxis Label the points according to their data labe...
Get Instant Access to Expert-Tailored Solutions
See step-by-step solutions with expert insights and AI powered tools for academic success
Step: 2

Step: 3

Ace Your Homework with AI
Get the answers you need in no time with our AI-driven, step-by-step assistance
Get Started


