

Answered step by step
Verified Expert Solution
Question
1 Approved Answer
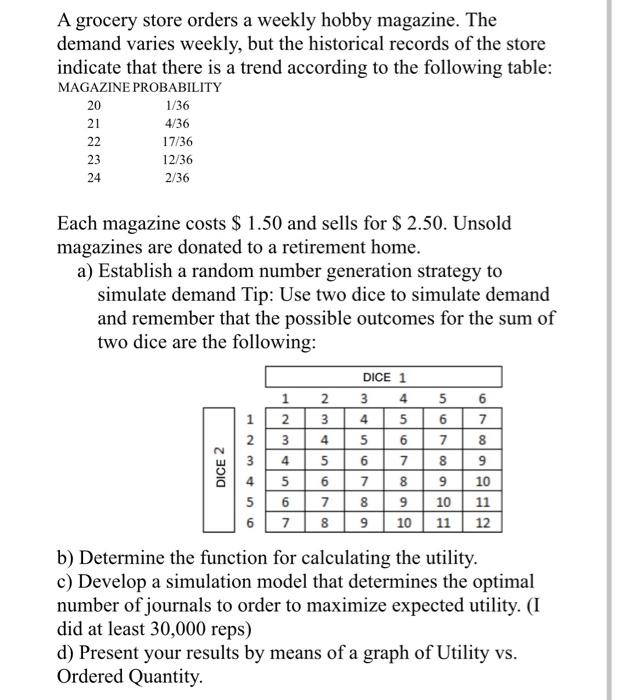
A grocery store orders a weekly hobby magazine. The demand varies weekly, but the historical records of the store indicate that there is a trend
Step by Step Solution
There are 3 Steps involved in it
Step: 1

Get Instant Access to Expert-Tailored Solutions
See step-by-step solutions with expert insights and AI powered tools for academic success
Step: 2

Step: 3
Ace Your Homework with AI
Get the answers you need in no time with our AI-driven, step-by-step assistance
Get Started
Financial Accounting
Authors: Warren, Reeve, Duchac
12th Edition
1133952410, 9781133952411, 978-1133952428