A hospital in the United States wants to evaluate their success rate of heart transplant surgeries. We observe the number of deaths, y, in a
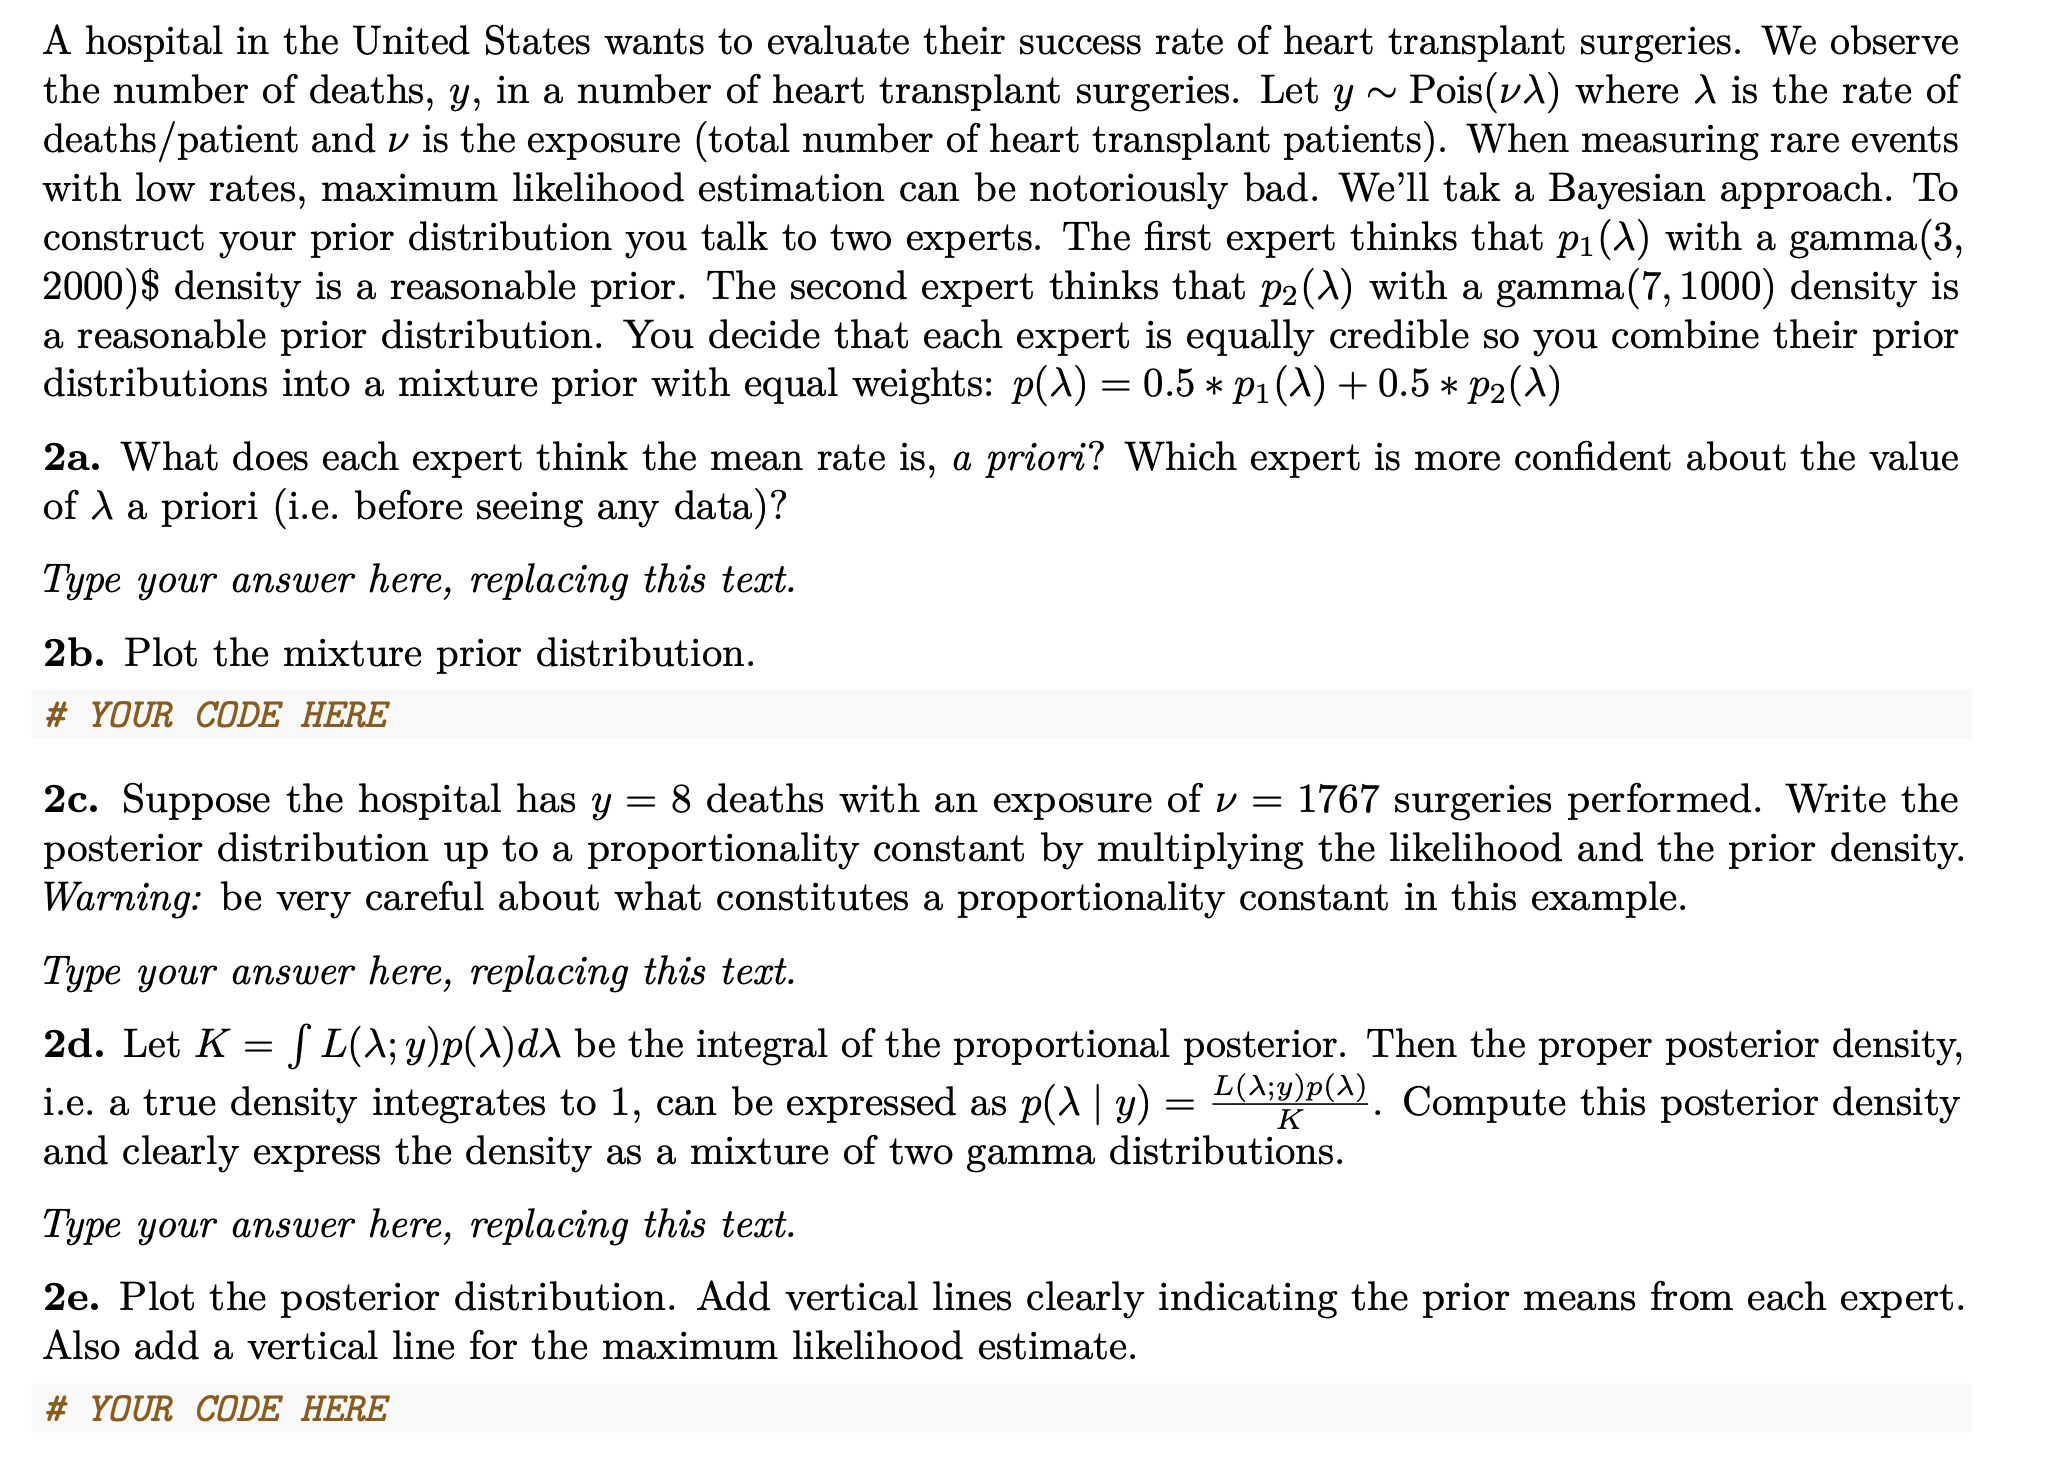
A hospital in the United States wants to evaluate their success rate of heart transplant surgeries. We observe the number of deaths, y, in a number of heart transplant surgeries. Let y N Pois(1/)\\) where A is the rate of deaths / patient and V is the exposure (total number of heart transplant patients). When measuring rare events with low rates, maximum likelihood estimation can be notoriously bad. We'll tak a Bayesian approach. To construct your prior distribution you talk to two experts. The rst expert thinks that p1()\\) with a gamma(3, 2000)$ density is a reasonable prior. The second expert thinks that p20.) with a gamma(7, 1000) density is a reasonable prior distribution. You decide that each expert is equally credible so you combine their prior distributions into a mixture prior with equal weights: p()\\) = 0.5 * 1910') + 0.5 * p2()\\) 2a. What does each expert think the mean rate is, a priori? Which expert is more condent about the value of A a priori (i.e. before seeing any data)? Type your answer here, replacing this text. 2b. Plot the mixture prior distribution. # YOUR CODE HERE 2c. Suppose the hospital has y = 8 deaths with an exposure of V = 1767 surgeries performed. Write the posterior distribution up to a proportionality constant by multiplying the likelihood and the prior density. Warning: be very careful about what constitutes a proportionality constant in this example. Type your answer here, replacing this text. 2d. Let K = f L(A; y)p()\\)d)\\ be the integral of the proportional posterior. Then the proper posterior density, i.e. a true density integrates to 1, can be expressed as p()\\ | y) = W and clearly express the density as a mixture of two gamma distributions. . Compute this posterior density Type your answer here, replacing this text. 2e. Plot the posterior distribution. Add vertical lines clearly indicating the prior means from each expert. Also add a vertical line for the maximum likelihood estimate. # YOUR CODE HERE
Step by Step Solution
There are 3 Steps involved in it
Step: 1
Get Instant Access to Expert-Tailored Solutions
See step-by-step solutions with expert insights and AI powered tools for academic success
Step: 2
Step: 3
Ace Your Homework with AI
Get the answers you need in no time with our AI-driven, step-by-step assistance