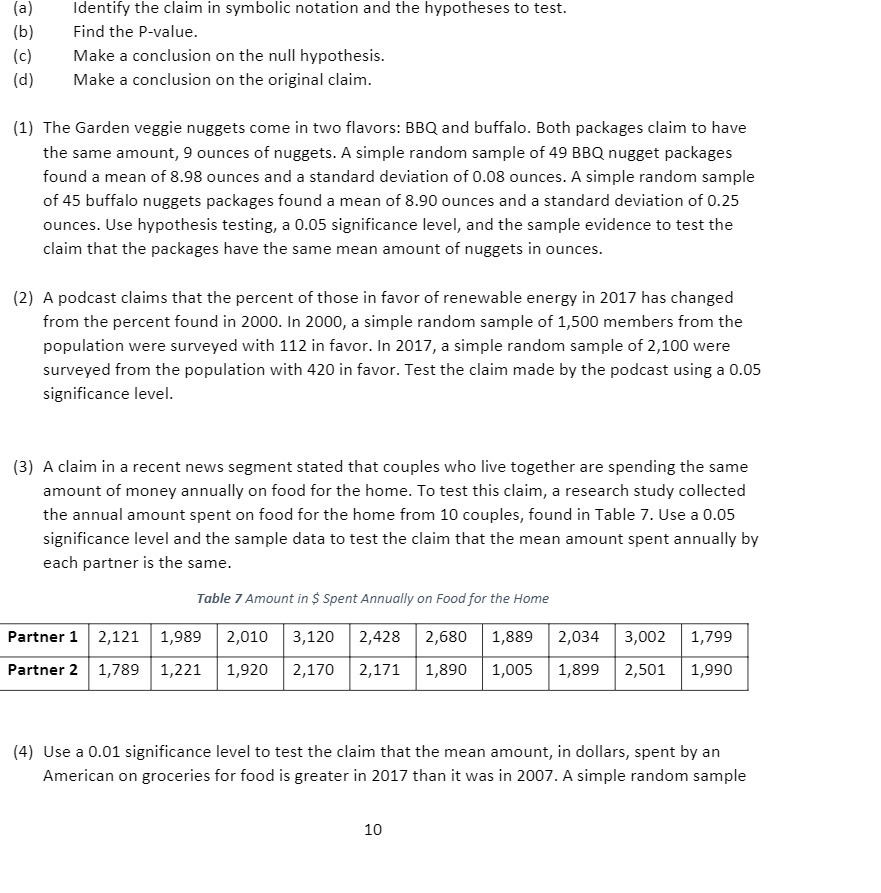
(a) Identify the claim in symbolic notation and the hypotheses to test. (b) Find the Pvalue. (c) Make a conclusion on the null hypothesis. (d) Make a conclusion on the original claim. [1} The Garden veggie nuggets come in two flavors: BBQ and buffalo. Both packages claim to have the same amount, 9 ounces of nuggets. A simple random sample of 49 BBQ nugget packages found a mean of 3.93 ounces and a standard deviation of 0.08 ounces. A simple random sample of 45 buffalo nuggets packages found a mean of 3.90 ounces and a standard deviation of 0.25 ounces. Use hypothesis testing, a l0.05 significance level, and the sample evidence to test the claim that the packages have the same mean amount of nuggets in ounces. [2} A podcast claims that the percent of those in favor of renewable energy in 2017 has changed from the percent found in 2000. In 2000, a simple random sample of 1,500 members from the population were surveyed with 112 in favor. In 2017, a simple random sample of 2,100 were surveyed from the population with 420 in favor. Test the claim made by the podcast using a 0.05 signicance level. (3} A claim in a recent news segment stated that couples who live together are spending the same amount of money annually on food for the home. To test this claim, a research study collected the annual amount spent on food for the home from 10 couples, found in Table 3". Use a 0.05 signicance level and the sample data to test the claim that the mean amount spent annually by each partner is the same. Table J'Amount In S SpenrAnnuolly on Food for the Home Partnerl 2,121 1,939 2,019 3,120 2,423 2,539 1,339 2,034 3,002 1,299 PartnerZ 1,239 1,221 1,929 2,170 2,171 1,399 1,095 1,399 2,501 1,990 [4} Use a 0.01 significance level to test the claim that the mean amount, in dollars, spent by an American on groceries for food is greater in 201? than it was in 2001.5. simple random sample 10