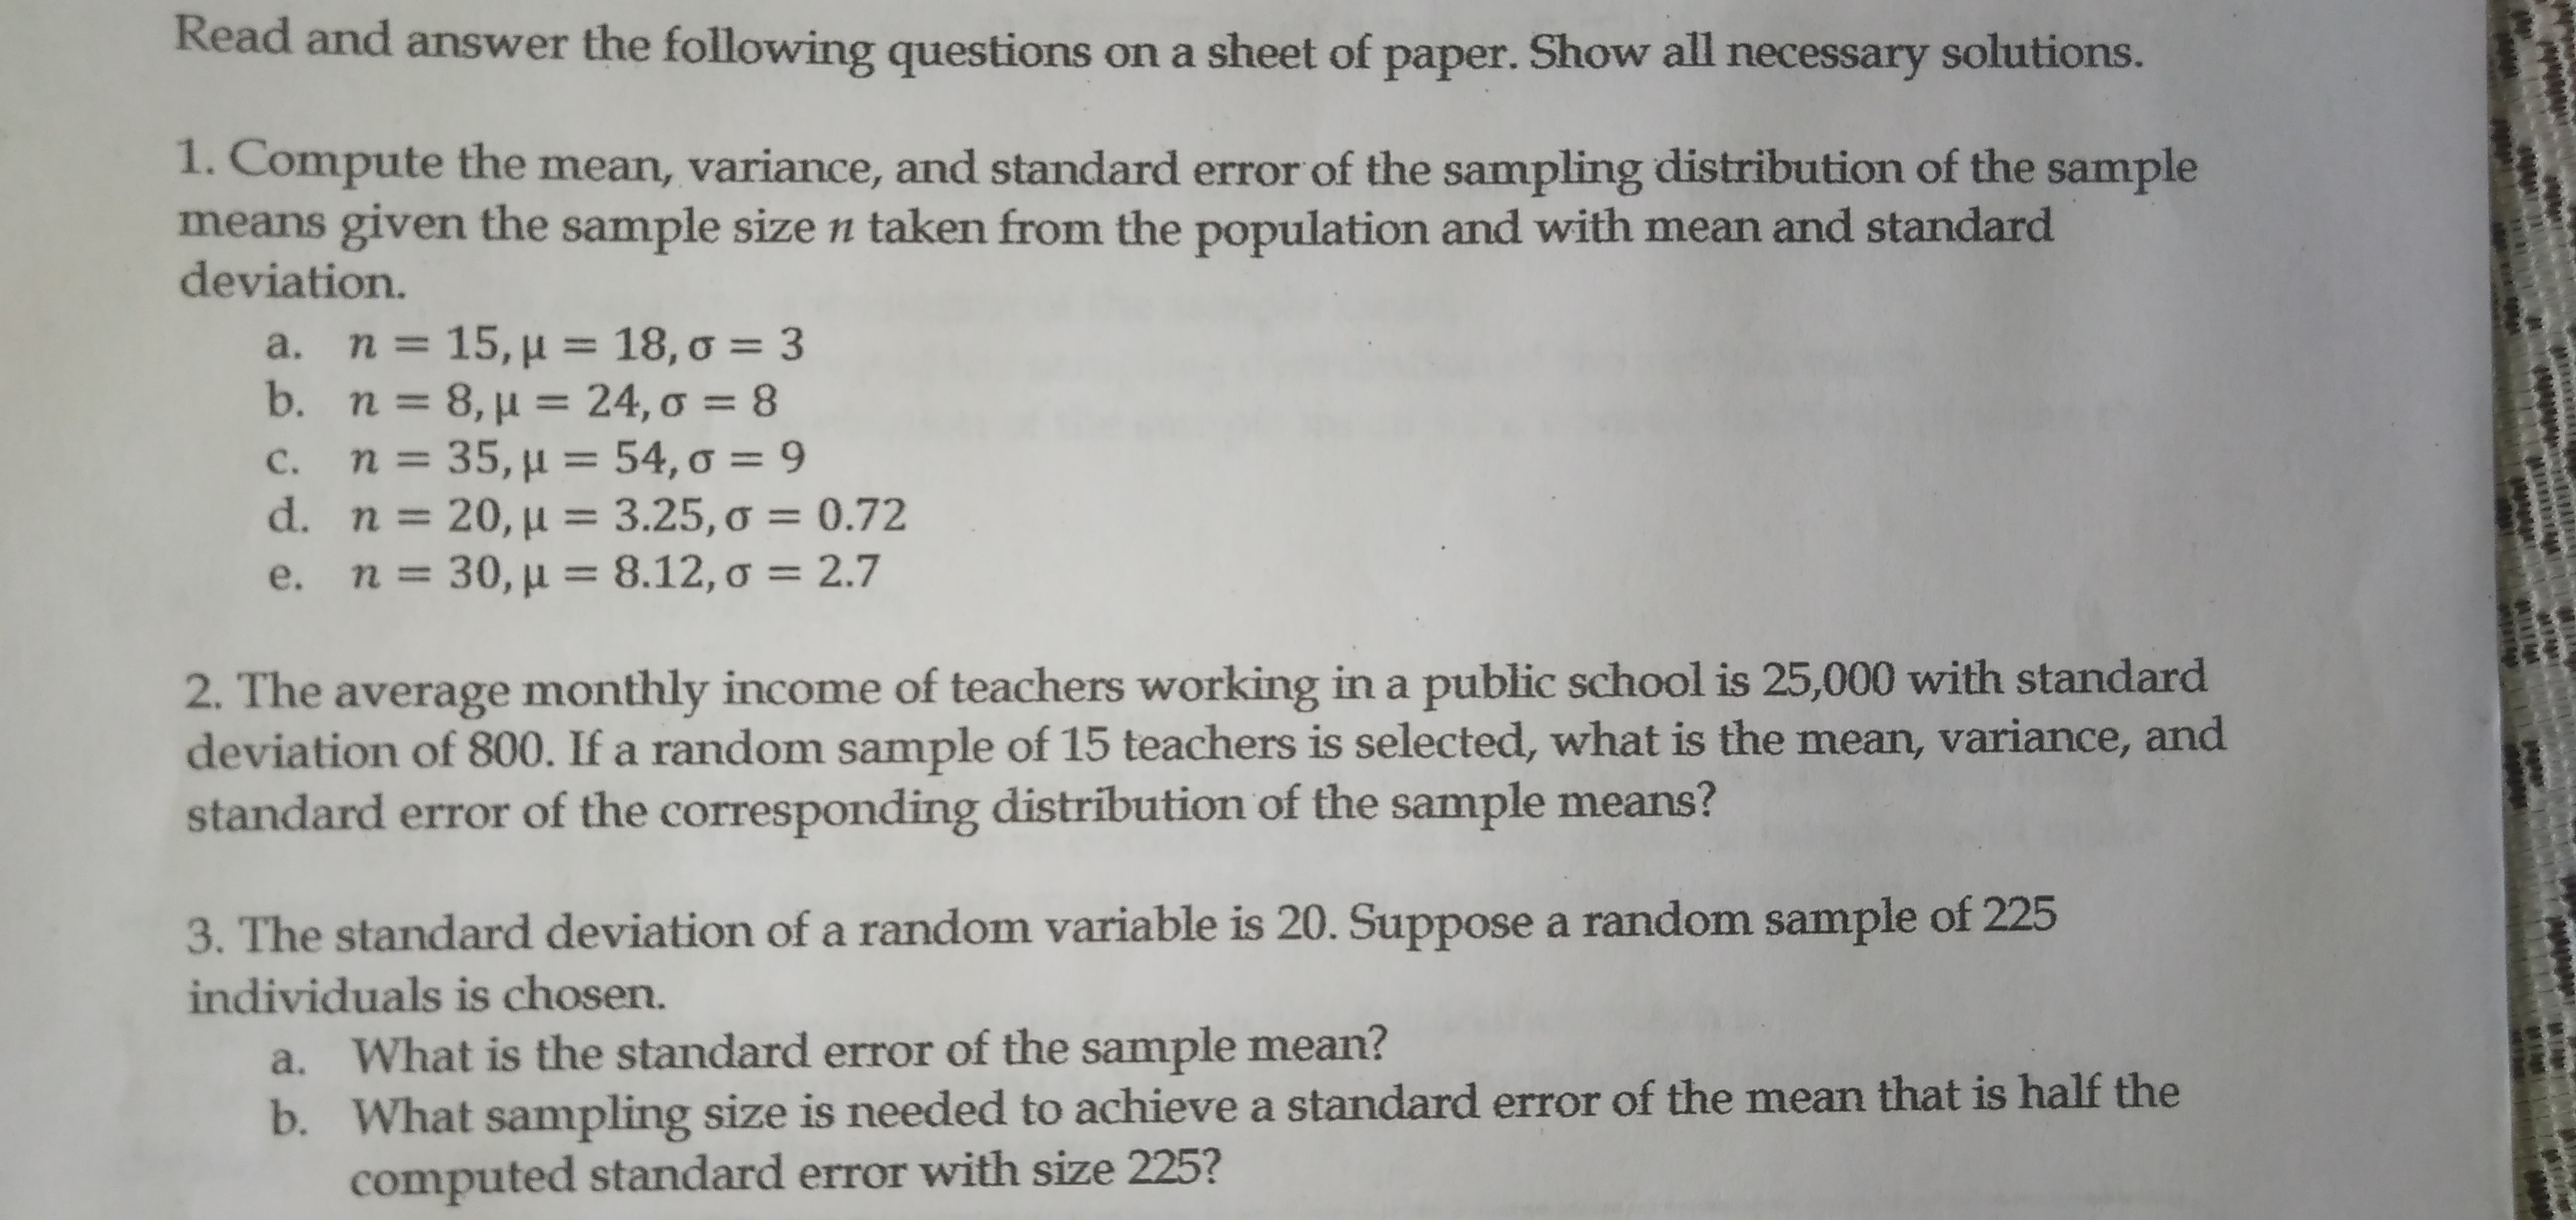
Question
A. Identify the type of sampling method used in the following scenarios. The following response options are: SYSTEMATIC SAMPLE, CLUSTER SAMPLE, SIMPLE RANDOM SAMPLE, STRATIFIED
A. Identify the type of sampling method used in the following scenarios. The following response options are: SYSTEMATIC SAMPLE, CLUSTER SAMPLE, SIMPLE RANDOM SAMPLE, STRATIFIED RANDOM SAMPLE.
________________1. In a factory that produces television sets, every 100th set produced is inspected.
________________2. A class of 200 learners is numbered from 1 to 200, and a table of random digits is used to choose 60 learners from the class.
________________3. A class learners are seated in 10 rows of 20 learners per row. Three learners are randomly selected from every row.
________________4. An airplane company randomly chooses one flight from a list of all international flights taking place that day. All passengers on that selected flight are asked to fill out a survey on meal satisfaction.
________________5. A company executive selected 10 participants for the international business congress by writing the names of all employees and then choosing a name one at a time until the delegation is completed.
B. Determine whether the following examples refer to a POPULATION or SAMPLE.
________________1. The total number of students of SPAS.
________________2. A group of 10 teachers in a school to attend a seminar workshop.
________________3. List of all the provinces of the Philippines.
________________4. The top ten most requested song of the year 2020.
________________5. The total number of residents of Partia.
C. Determine the number of possible samples with size n=3 from a population with the following sizes using formula: nCn.
- N = 4 2. N = 8 3. N = 10 4. N = 12 5. N = 20 6. N = 50
D. Given: A group of students got the following scores in attest 6,9,15,18, and 21. Consider a sample of size 3 that can be drawn from the population. Answer the following:
- How many possible samples can be drawn?
- List all the possible samples and the corresponding mean.
- Construct the sampling distribution of the sample mean.
E. Compute the MEAN, VARIANCE, and STANDARD ERROR of the sampling distribution of the sample means given the sample size n taken from the population with mean ? and standard deviation ?.
- n=30 ;?=8.12 ;?=2.7
- 2. n=8 ;?=24 ;?=8
- 3. n=35 ;?=54 ;?=9
- 4. n=20 ;?=3.25 ;?=0.72
Lesson Title: Sampling distribution
A. Answer the following. Show all solutions
1) The following are the ages of 8 jeepney passengers in a waiting shed: 12, 15, 18, 19, 21, 23, 35, and 40. A sample with size 7 is chosen to ride in the current jeepney.
a. construct the distribution of the standard deviations of all samples.
b. find the mean of the sample standard deviations.
c. determine the standard error of the sample standard deviations.
2) Random samples with size 5 are drawn from the populations containing the values 26, 32, 41, 50, 58, and 63.
a. determine the number of all possible samples with size 5.
b. identify the distribution of the sample means.
c. compute the mean and standard error of the corresponding sampling distribution.
3) Explain the meaning of the standard error in a given sampling distribution. What does the standard error represents?
Lesson Title: Sampling Distribution of the Sample Means
Read and answer the following questions. Show all solution

Step by Step Solution
There are 3 Steps involved in it
Step: 1

Get Instant Access to Expert-Tailored Solutions
See step-by-step solutions with expert insights and AI powered tools for academic success
Step: 2

Step: 3

Ace Your Homework with AI
Get the answers you need in no time with our AI-driven, step-by-step assistance
Get Started


