

Answered step by step
Verified Expert Solution
Question
1 Approved Answer
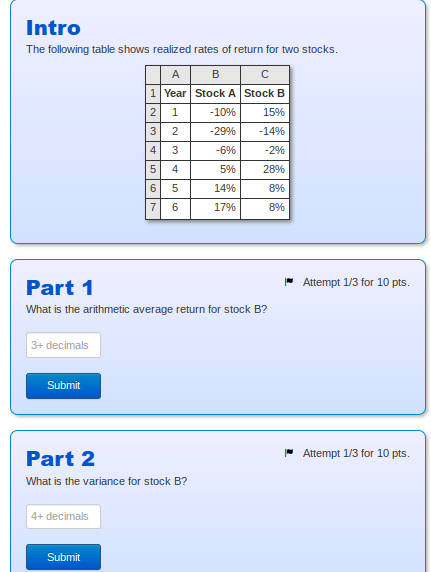
A Intro The following table shows realized rates of return for two stocks. A B 1 Year Stock A Stock B 2 1 -10% 15%
Step by Step Solution
There are 3 Steps involved in it
Step: 1

Get Instant Access to Expert-Tailored Solutions
See step-by-step solutions with expert insights and AI powered tools for academic success
Step: 2

Step: 3
Ace Your Homework with AI
Get the answers you need in no time with our AI-driven, step-by-step assistance
Get Started
The Little Book Of Market Wizards Lessons From The Greatest Traders
Authors: Jack D. Schwager
1st Edition
1118858697, 978-1118858691