Question
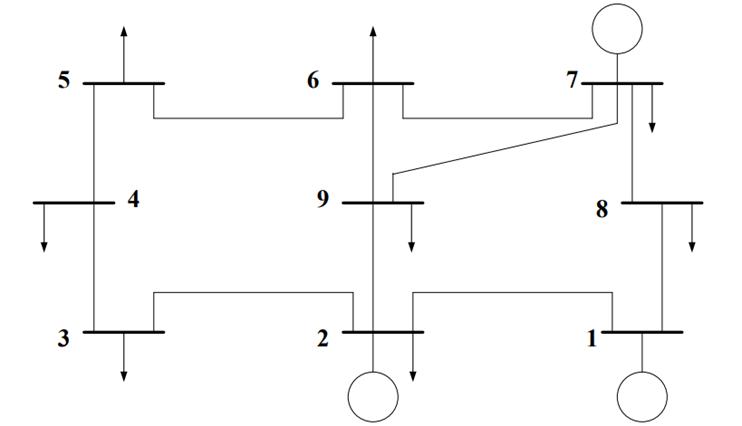
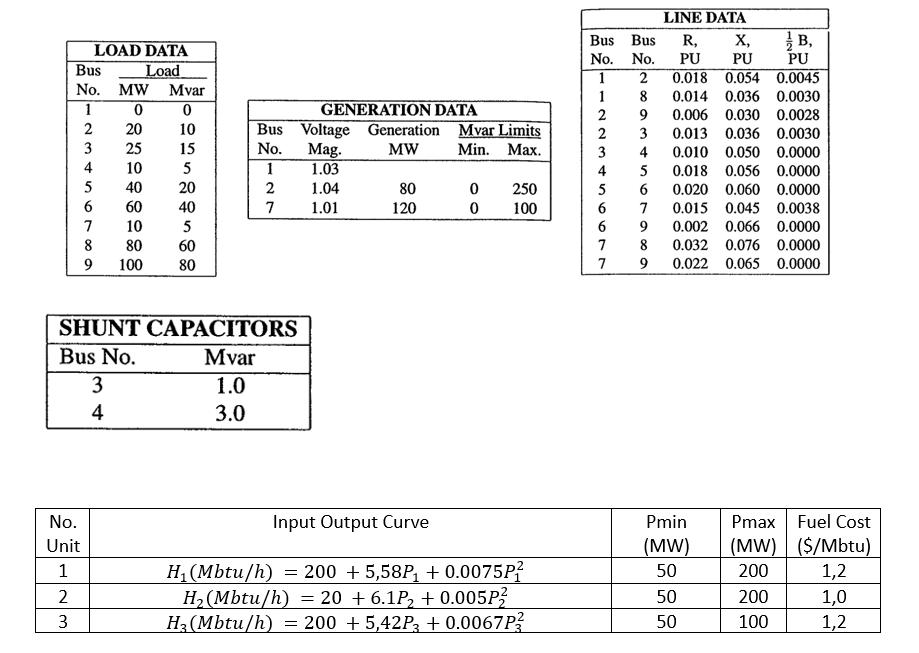
A known Single Line Diagram of an electric power system is shown in the figure below. Using the data in the table above, determine: (Use
A known Single Line Diagram of an electric power system is shown in the figure below.


Using the data in the table above, determine: (Use Matlab software to solve the problem)
a) Determine the loss coefficient of the electric power system
b) Determine the optimal loading of each generator
c) Determine the total cost and transmission loss of the system at optimal conditions
3 !! 2 7. 8
Step by Step Solution
3.48 Rating (155 Votes )
There are 3 Steps involved in it
Step: 1
To determine the loss coefficient of the electric power system optimal loading of each generator and ...
Get Instant Access to Expert-Tailored Solutions
See step-by-step solutions with expert insights and AI powered tools for academic success
Step: 2

Step: 3

Ace Your Homework with AI
Get the answers you need in no time with our AI-driven, step-by-step assistance
Get StartedRecommended Textbook for
Modern Control Systems
Authors: Richard C. Dorf, Robert H. Bishop
12th edition
136024580, 978-0136024583
Students also viewed these Electrical Engineering questions
Question
Answered: 1 week ago
Question
Answered: 1 week ago
Question
Answered: 1 week ago
Question
Answered: 1 week ago
Question
Answered: 1 week ago
Question
Answered: 1 week ago
Question
Answered: 1 week ago
Question
Answered: 1 week ago
Question
Answered: 1 week ago
Question
Answered: 1 week ago
Question
Answered: 1 week ago
Question
Answered: 1 week ago
Question
Answered: 1 week ago
Question
Answered: 1 week ago
Question
Answered: 1 week ago
Question
Answered: 1 week ago
Question
Answered: 1 week ago
Question
Answered: 1 week ago
Question
Answered: 1 week ago
Question
Answered: 1 week ago
Question
Answered: 1 week ago
Question
Answered: 1 week ago
View Answer in SolutionInn App


