

Question
A large sales organization has collected data on the number of employees and the annual gross sales during the last 7 years. (a) Develop a
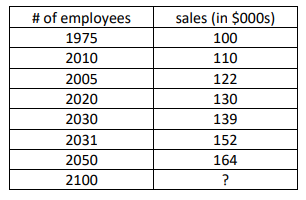
A large sales organization has collected data on the number of employees and the annual gross sales during the last 7 years.
(a) Develop a scatter diagram.
(b) Determine the correlation coefficient.
(c) Determine the coefficient of determination.
(d) Determine the least squares trend line by hand not QM
(e) Determine the predicted value of sales for 2100 employees
\begin{tabular}{|c|c|} \hline \# of employees & sales (in \$000s) \\ \hline 1975 & 100 \\ \hline 2010 & 110 \\ \hline 2005 & 122 \\ \hline 2020 & 130 \\ \hline 2030 & 139 \\ \hline 2031 & 152 \\ \hline 2050 & 164 \\ \hline 2100 & ? \\ \hline \end{tabular}Step by Step Solution
There are 3 Steps involved in it
Step: 1

Get Instant Access to Expert-Tailored Solutions
See step-by-step solutions with expert insights and AI powered tools for academic success
Step: 2

Step: 3
Ace Your Homework with AI
Get the answers you need in no time with our AI-driven, step-by-step assistance
Get Started
Stand Up To The IRS How To Handle Audits Tax Bills And Tax Court
Authors: Frederick W. Daily Robin Leonard
2nd Edition
0873372409, 978-0873372404