Answered step by step
Verified Expert Solution
Question
1 Approved Answer
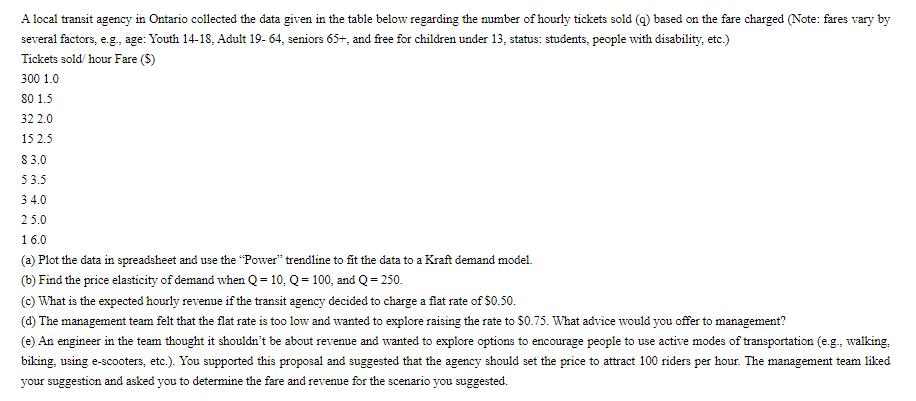
A local transit agency in Ontario collected the data given in the table below regarding the number of hourly tickets sold (q) based on

A local transit agency in Ontario collected the data given in the table below regarding the number of hourly tickets sold (q) based on the fare charged (Note: fares vary by several factors, e.g., age: Youth 14-18, Adult 19-64, seniors 65+, and free for children under 13, status: students, people with disability, etc.) Tickets sold/ hour Fare (S) 300 1.0 80 1.5 32 2.0 152.5 83.0 53.5 3 4.0 25.0 16.0 (a) Plot the data in spreadsheet and use the "Power" trendline to fit the data to a Kraft demand model. (b) Find the price elasticity of demand when Q = 10, Q = 100, and Q = 250. (c) What is the expected hourly revenue if the transit agency decided to charge a flat rate of $0.50. (d) The management team felt that the flat rate is too low and wanted to explore raising the rate to $0.75. What advice would you offer to management? (e) An engineer in the team thought it shouldn't be about revenue and wanted to explore options to encourage people to use active modes of transportation (e.g., walking, biking, using e-scooters, etc.). You supported this proposal and suggested that the agency should set the price to attract 100 riders per hour. The management team liked your suggestion and asked you to determine the fare and revenue for the scenario you suggested.
Step by Step Solution
★★★★★
3.38 Rating (151 Votes )
There are 3 Steps involved in it
Step: 1
The detailed answer for the above question is provided below a Here is the plot of the data in Excel ...
Get Instant Access to Expert-Tailored Solutions
See step-by-step solutions with expert insights and AI powered tools for academic success
Step: 2

Step: 3

Ace Your Homework with AI
Get the answers you need in no time with our AI-driven, step-by-step assistance
Get Started


