

Answered step by step
Verified Expert Solution
Question
1 Approved Answer
A manufacturing facility in Omaha must ship its product to customers in Bismarck, Little Rock, Toronto, Denver, Seattle, and Tulsa. The manufacturer can ship the
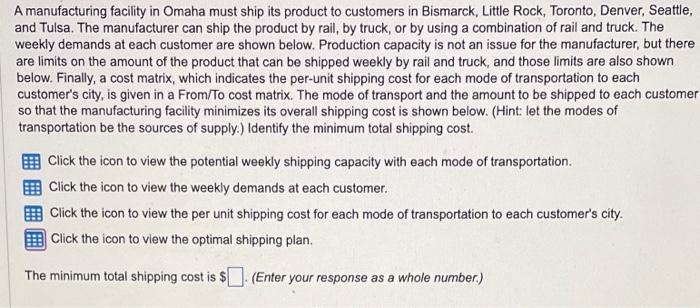
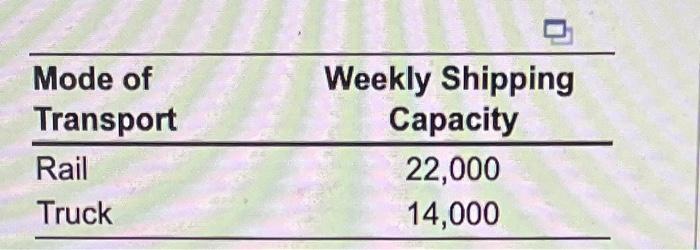
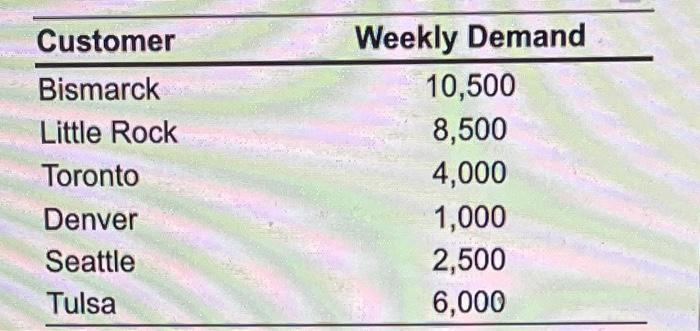
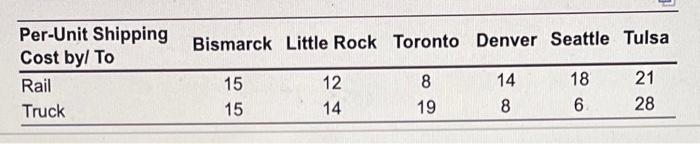
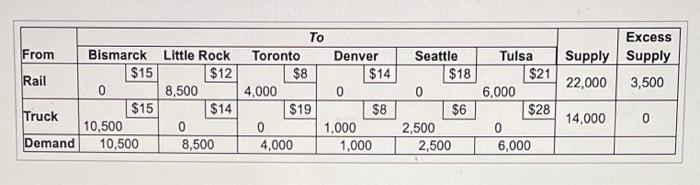 A manufacturing facility in Omaha must ship its product to customers in Bismarck, Little Rock, Toronto, Denver, Seattle, and Tulsa. The manufacturer can ship the product by rail, by truck, or by using a combination of rail and truck. The weekly demands at each customer are shown below. Production capacity is not an issue for the manufacturer, but there are limits on the amount of the product that can be shipped weekly by rail and truck, and those limits are also shown below. Finally, a cost matrix, which indicates the per-unit shipping cost for each mode of transportation to each customer's city, is given in a From/To cost matrix. The mode of transport and the amount to be shipped to each customer so that the manufacturing facility minimizes its overall shipping cost is shown below. (Hint: let the modes of transportation be the sources of supply.) Identify the minimum total shipping cost. Click the icon to view the potential weekly shipping capacity with each mode of transportation. Click the icon to view the weekly demands at each customer. Click the icon to view the per unit shipping cost for each mode of transportation to each customer's city. Click the icon to view the optimal shipping plan. The minimum total shipping cost is $ (Enter your response as a whole number.) \begin{tabular}{lc} \hline Mode of & Weekly Shipping \\ Transport & Capacity \\ \hline Rail & 22,000 \\ Truck & 14,000 \\ \hline \end{tabular} \begin{tabular}{lc} \hline Customer & Weekly Demand \\ \hline Bismarck & 10,500 \\ Little Rock & 8,500 \\ Toronto & 4,000 \\ Denver & 1,000 \\ Seattle & 2,500 \\ Tulsa & 6,000 \\ \hline \end{tabular} \begin{tabular}{lcccccc} \hline Per-Unit Shipping Cost byl To & Bismarck & Little Rock & Toronto & Denver & Seattle & Tulsa \\ \hline Rail & 15 & 12 & 8 & 14 & 18 & 21 \\ Truck & 15 & 14 & 19 & 8 & 6 & 28 \\ \hline \end{tabular} A manufacturing facility in Omaha must ship its product to customers in Bismarck, Little Rock, Toronto, Denver, Seattle, and Tulsa. The manufacturer can ship the product by rail, by truck, or by using a combination of rail and truck. The weekly demands at each customer are shown below. Production capacity is not an issue for the manufacturer, but there are limits on the amount of the product that can be shipped weekly by rail and truck, and those limits are also shown below. Finally, a cost matrix, which indicates the per-unit shipping cost for each mode of transportation to each customer's city, is given in a From/To cost matrix. The mode of transport and the amount to be shipped to each customer so that the manufacturing facility minimizes its overall shipping cost is shown below. (Hint: let the modes of transportation be the sources of supply.) Identify the minimum total shipping cost. Click the icon to view the potential weekly shipping capacity with each mode of transportation. Click the icon to view the weekly demands at each customer. Click the icon to view the per unit shipping cost for each mode of transportation to each customer's city. Click the icon to view the optimal shipping plan. The minimum total shipping cost is $ (Enter your response as a whole number.) \begin{tabular}{lc} \hline Mode of & Weekly Shipping \\ Transport & Capacity \\ \hline Rail & 22,000 \\ Truck & 14,000 \\ \hline \end{tabular} \begin{tabular}{lc} \hline Customer & Weekly Demand \\ \hline Bismarck & 10,500 \\ Little Rock & 8,500 \\ Toronto & 4,000 \\ Denver & 1,000 \\ Seattle & 2,500 \\ Tulsa & 6,000 \\ \hline \end{tabular} \begin{tabular}{lcccccc} \hline Per-Unit Shipping Cost byl To & Bismarck & Little Rock & Toronto & Denver & Seattle & Tulsa \\ \hline Rail & 15 & 12 & 8 & 14 & 18 & 21 \\ Truck & 15 & 14 & 19 & 8 & 6 & 28 \\ \hline \end{tabular}
Step by Step Solution
There are 3 Steps involved in it
Step: 1

Get Instant Access to Expert-Tailored Solutions
See step-by-step solutions with expert insights and AI powered tools for academic success
Step: 2

Step: 3
Ace Your Homework with AI
Get the answers you need in no time with our AI-driven, step-by-step assistance
Get Started
Market Audit And Analysis
Authors: Nicole Lorat
1st Edition
3640438892, 978-3640438891