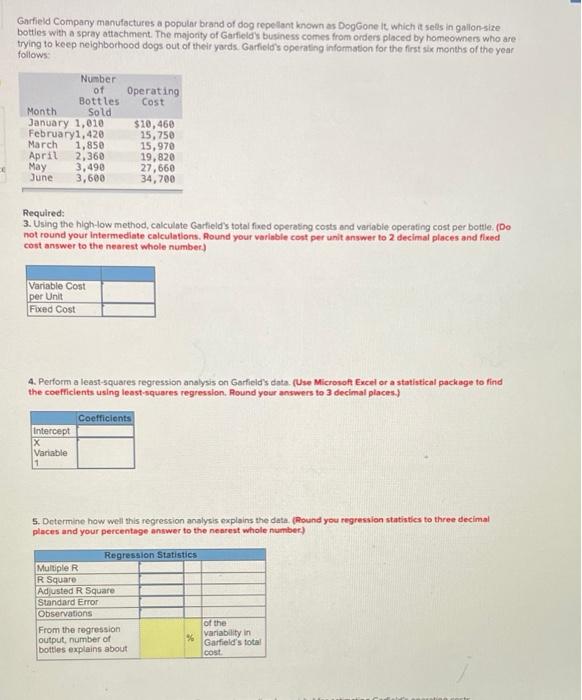
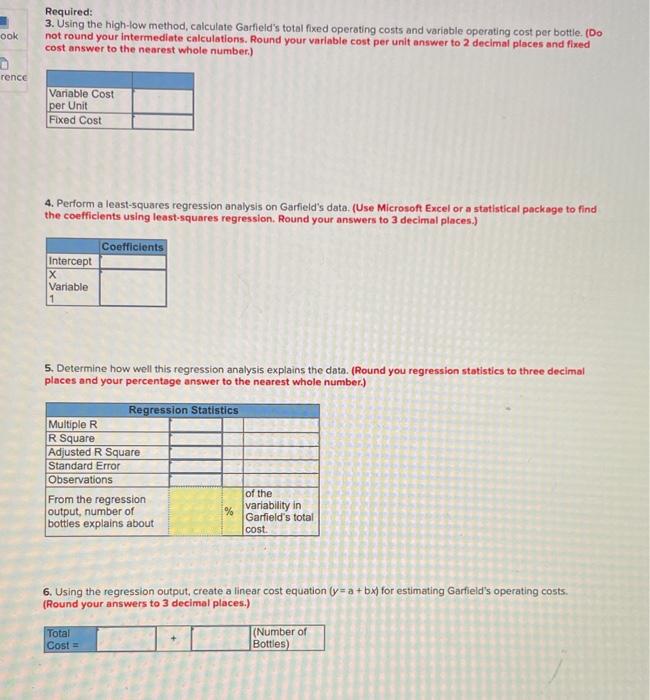
Garfield Company manufactures a popular brand of dog repellant known as DogGone lt which sels in gallon-size bottles with a spray attachment. The majority of Garfield business comes from orders placed by homeowners who are trying to keep neighborhood dogs out of their yards. Garfield's operating information for the first six months of the your follows: Number of Operating Bottles Cost Month Sold January 1,010 $10,460 February1,420 25,750 March 1,850 15,970 April 2,360 19,820 May 3,490 27,660 June 3,600 34,700 E Required: 3. Using the high-low method, calculate Garfield's total fixed operating costs and variable operating cost per bottle (Do not round your Intermediate calculations. Round your variable cost per unit answer to 2 decimal places and feed cost answer to the nearest whole number) Variable Cost per Unit Fixed Cost 4. Perform a least-squares regression analysis on Garfield's data. (Use Microsoft Excel or a statistical package to find the coefficients using least squares regression. Round your answers to 3 decimal places.) Coefficients Intercept X Variable 5. Determine how well this regression analysis explains the data (Round you regression statisties to three decimal places and your percentage answer to the nearest whole number) Regression Statistics Multiple R R Square Adjusted R Square Standard Error Observations From the regression of the output, number of % variability in Garfield's total bottles explains about cost ook Required: 3. Using the high-low method, calculate Garfield's total fixed operating costs and variable operating cost per bottle. (Do not round your intermediate calculations. Round your variable cost per unit answer to 2 decimal places and fixed cost answer to the nearest whole number.) rence Variable Cost per Unit Fixed Cost 4. Perform a least-squares regression analysis on Garfield's data. (Use Microsoft Excel or a statistical package to find the coefficients using least-squares regression, Round your answers to 3 decimal places.) Coefficients Intercept X Variable 1 5. Determine how well this regression analysis explains the data. (Round you regression statistics to three decimal places and your percentage answer to the nearest whole number.) Regression Statistics Multiple R R Square Adjusted R Square Standard Error Observations From the regression variability in output, number of % Garfield's total bottles explains about cost. of the 6. Using the regression output, create a linear cost equation (y= a +bx) for estimating Garfield's operating costs. (Round your answers to 3 decimal places.) Total Cost = (Number of Bottles)


