

Answered step by step
Verified Expert Solution
Question
1 Approved Answer
A mayor in a large city claims that in one particularly depressed neighborhood, at least 2 0 % of all males between ages 1 8
A mayor in a large city claims that in one particularly depressed neighborhood, at least of all males between ages and are unemployed. A random sample of people from this population included twenty unemployed.
a Test the mayors claim at a significance level.
b Calculate the power of the test.
c Plot the power curve from b in R
d Looking at the graph from c for what values of p roughly is the power at least For those values of p what is the upper bound on the probability of Type II error?
e Whats the upper bound on the power for p
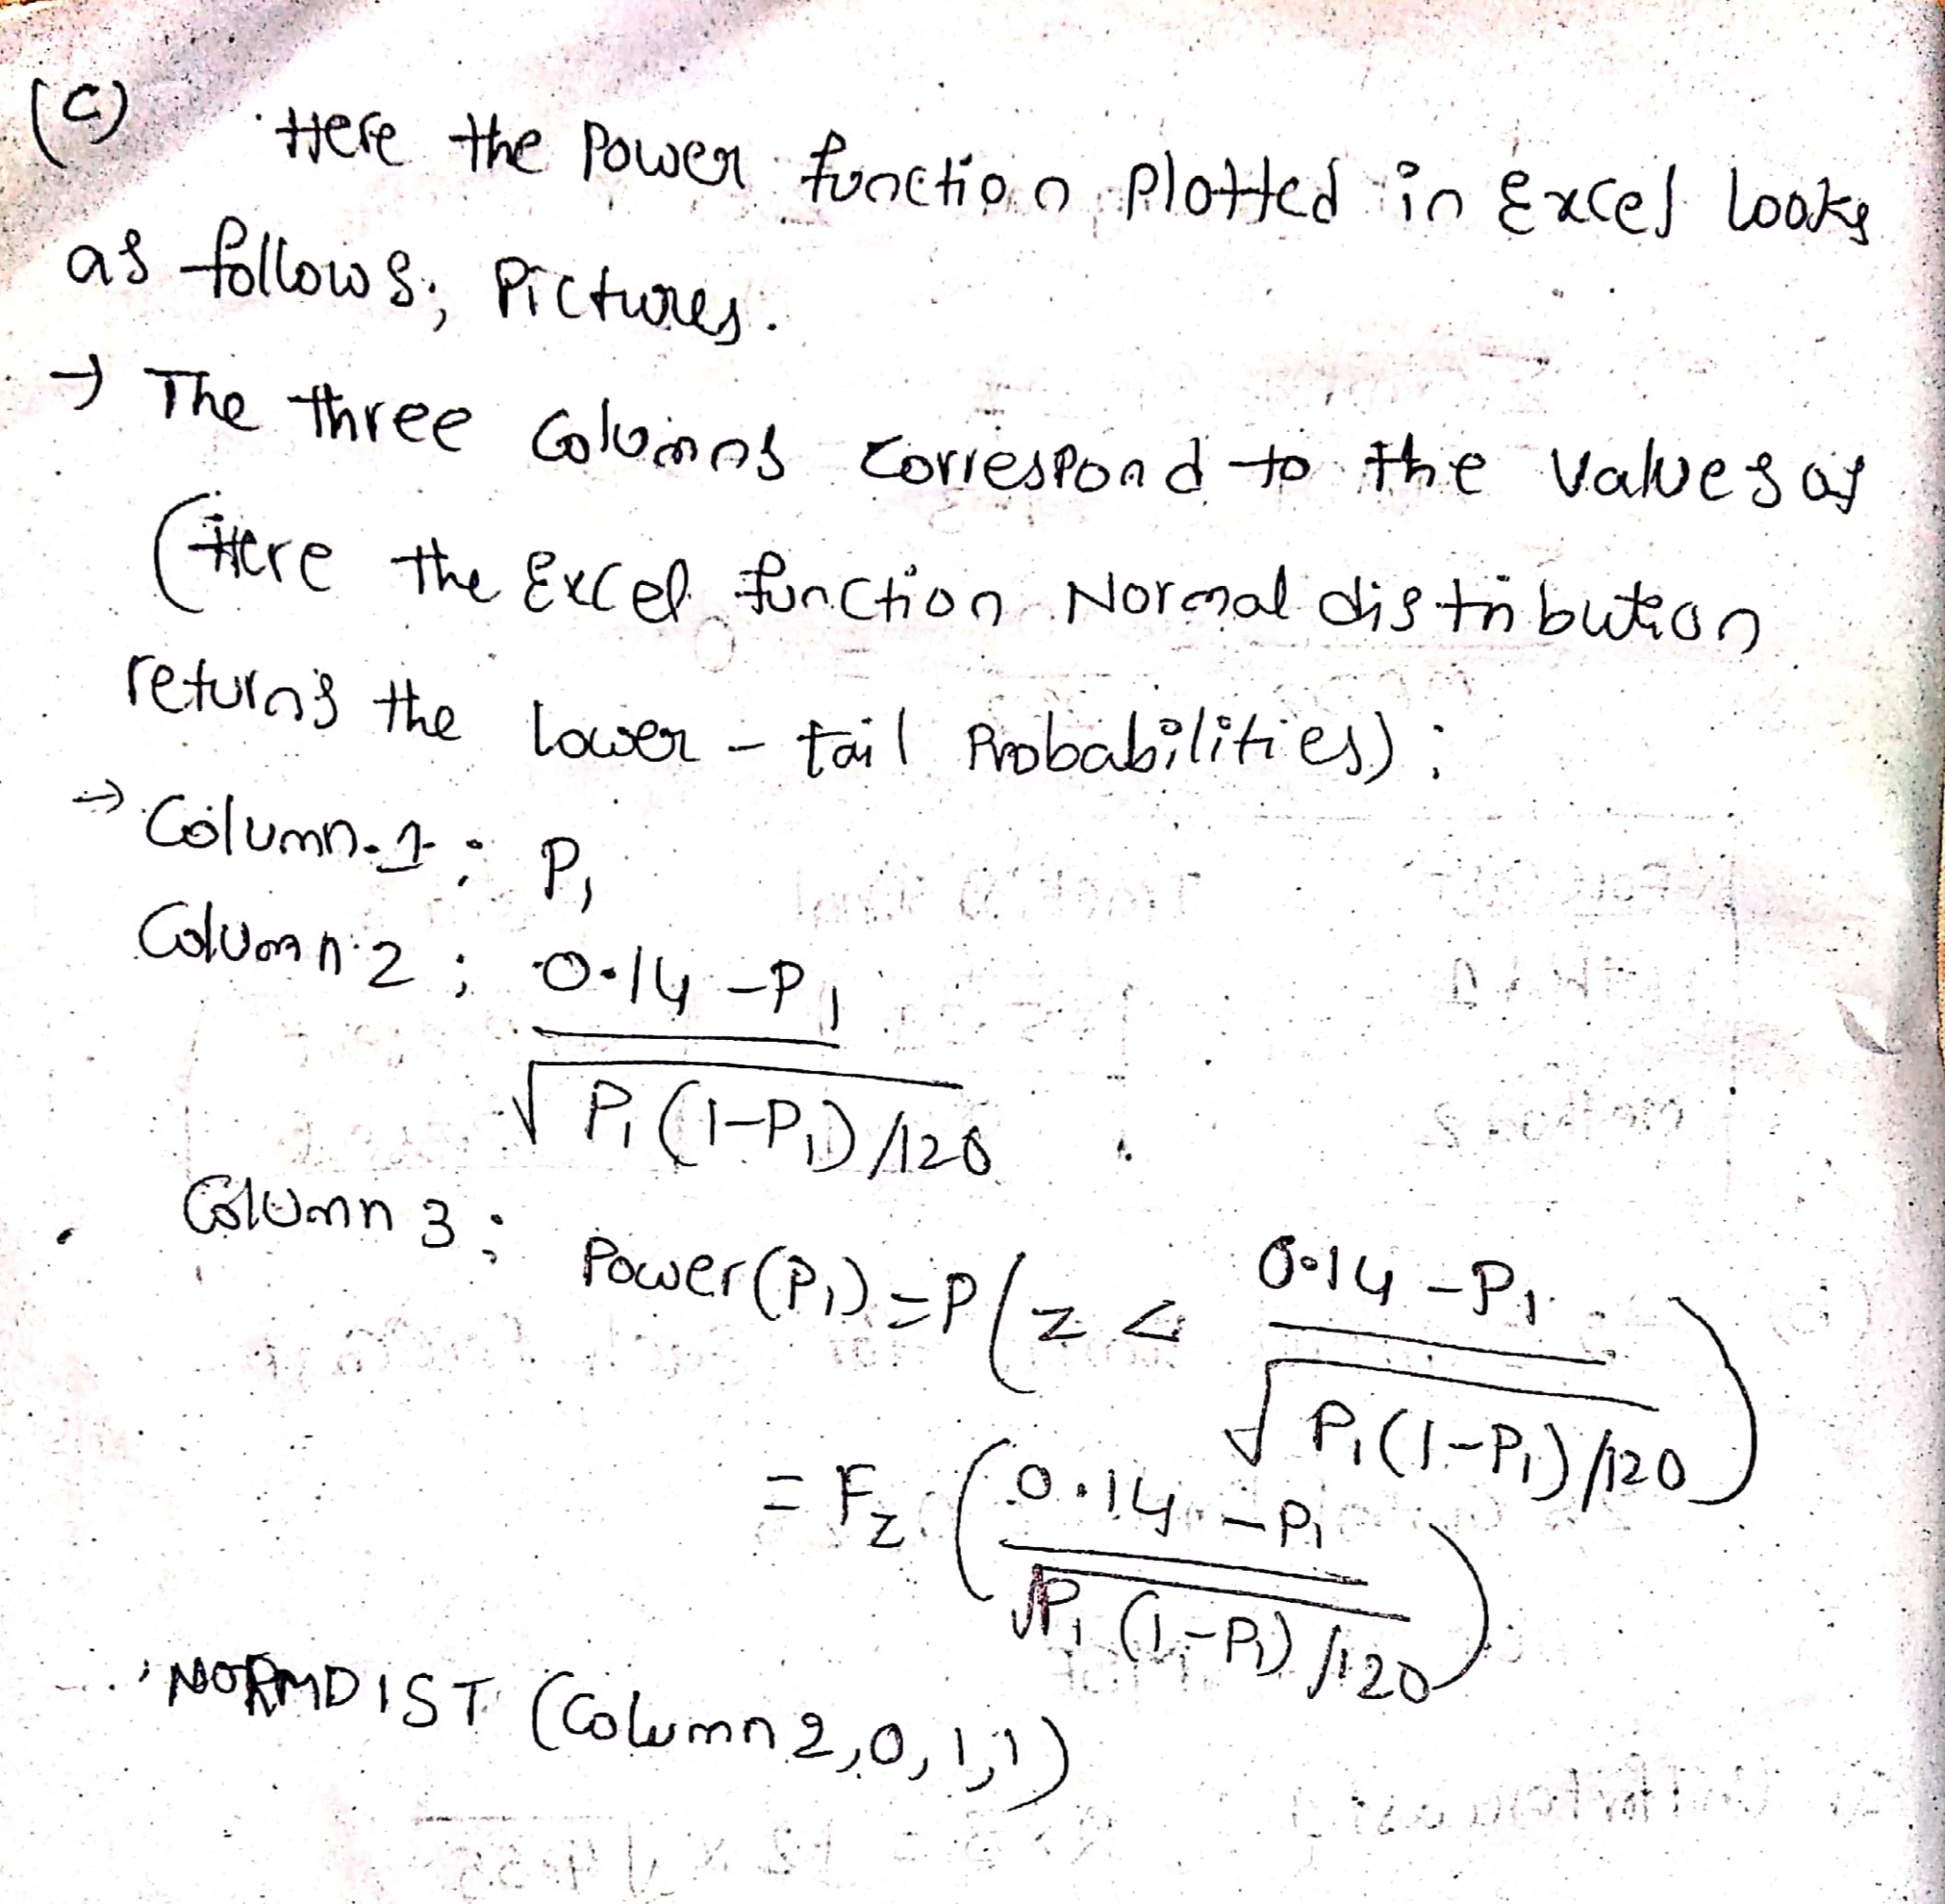
where do we get the here in answer to question c can someone please explain the concept of power. also explain the answer to question e c Here the power function plotted in excel looks
as follows; pictures.
The three colvins correspond to the values of
ficre the Excel function Normal distribution
refurnis the lowertail probabilities:
Column. :
Colvonn ;
Column :
Power
NoRmDIST umn :
Step by Step Solution
There are 3 Steps involved in it
Step: 1

Get Instant Access to Expert-Tailored Solutions
See step-by-step solutions with expert insights and AI powered tools for academic success
Step: 2

Step: 3
Ace Your Homework with AI
Get the answers you need in no time with our AI-driven, step-by-step assistance
Get Started
Semantics In Databases Second International Workshop Dagstuhl Castle Germany January 2001 Revised Papers Lncs 2582
Authors: Leopoldo Bertossi ,Gyula O.H. Katona ,Klaus-Dieter Schewe ,Bernhard Thalheim
2003rd Edition
3540009574, 978-3540009573