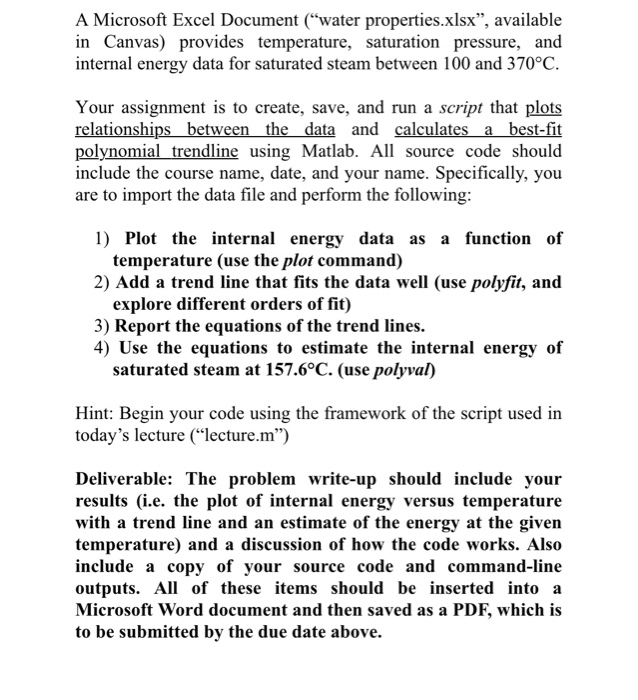
A Microsoft Excel Document ("water properties.xlsx", available in Canvas) provides temperature, saturation pressure, and internal energy data for saturated steam between 100 and 370C. Your assignment is to create, save, and run a script that plots relationships between the data and calculates a best-fit polynomial trendline using Matlab. All source code should include the course name, date, and your name. Specifically, you are to import the data file and perform the following: 1) Plot the internal energy data as a function of temperature (use the plot command) 2) Add a trend line that fits the data well (use polyfit, and explore different orders of fit) 3) Report the equations of the trend lines. 4) Use the equations to estimate the internal energy of saturated steam at 157.6C. (use polyval) Hint: Begin your code using the framework of the script used in today's lecture ("lecture.m") Deliverable: The problem write-up should include your results (i.e. the plot of internal energy versus temperature with a trend line and an estimate of the energy at the given temperature) and a discussion of how the code works. Also include a copy of your source code and command-line outputs. All of these items should be inserted into a Microsoft Word document and then saved as a PDF, which is to be submitted by the due date above. A Microsoft Excel Document ("water properties.xlsx", available in Canvas) provides temperature, saturation pressure, and internal energy data for saturated steam between 100 and 370C. Your assignment is to create, save, and run a script that plots relationships between the data and calculates a best-fit polynomial trendline using Matlab. All source code should include the course name, date, and your name. Specifically, you are to import the data file and perform the following: 1) Plot the internal energy data as a function of temperature (use the plot command) 2) Add a trend line that fits the data well (use polyfit, and explore different orders of fit) 3) Report the equations of the trend lines. 4) Use the equations to estimate the internal energy of saturated steam at 157.6C. (use polyval) Hint: Begin your code using the framework of the script used in today's lecture ("lecture.m") Deliverable: The problem write-up should include your results (i.e. the plot of internal energy versus temperature with a trend line and an estimate of the energy at the given temperature) and a discussion of how the code works. Also include a copy of your source code and command-line outputs. All of these items should be inserted into a Microsoft Word document and then saved as a PDF, which is to be submitted by the due date above


