Answered step by step
Verified Expert Solution
Question
1 Approved Answer
A model that attracted quite a bit of interest in macroeconomics in the 1970s was the St. Louis model. The underlying idea was to


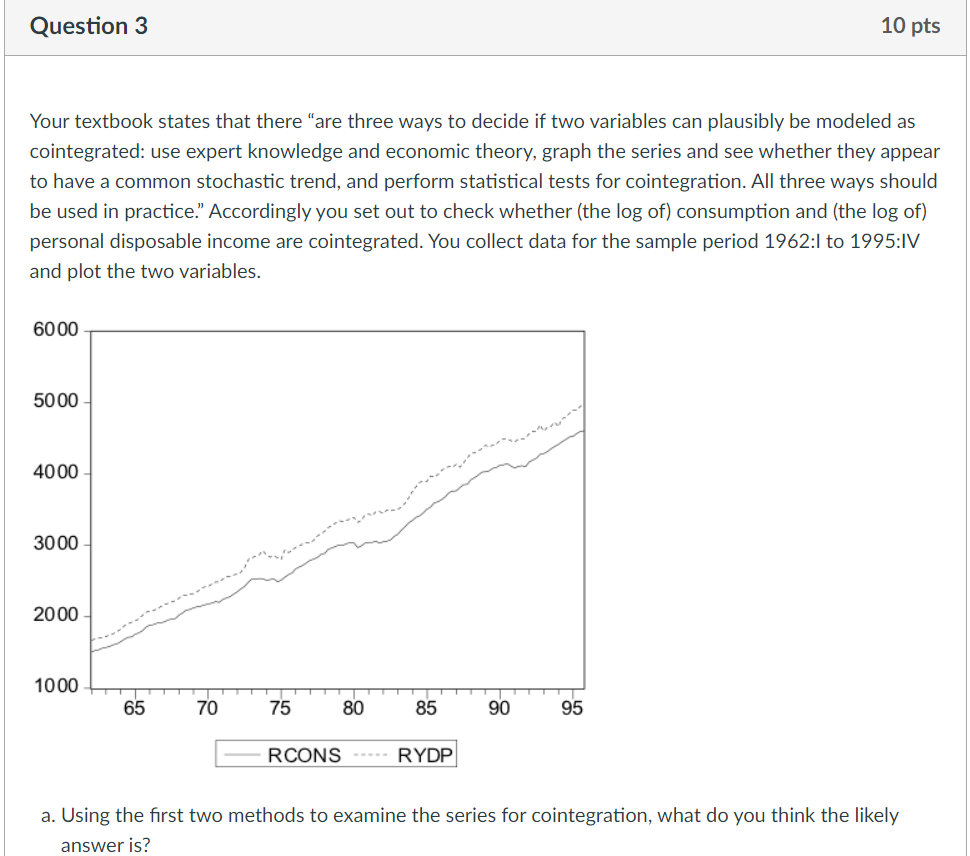
A model that attracted quite a bit of interest in macroeconomics in the 1970s was the St. Louis model. The underlying idea was to calculate fiscal and monetary impact and long run cumulative dynamic multipliers, by relating output (growth) to government expenditure (growth) and money supply (growth). The assumption was that both government expenditures and the money supply were exogenous. Estimation of a St. Louis type model using quarterly data from 1960:1-1995:IV results in the following output (HAC standard errors in parenthesis): ygrowth = 0.018 + 0.006dmgrowth+ + 0.235dmgrowth-1 +0.344dmgrowth+-2 (0.004) (0.079) (0.091) (0.087) + 0.385dmgroth+-3 + 0.425mgrowth+-4 + 0.170dggrowth - 0.044dggrowth+-1 (0.097) (0.069) (0.049) -0.003dggrowth+-2 -0.079dggrowth+-3 + 0.018ggrowth +-4; (0.040) R2 0.346, SER=0.03 (0.051) (0.027) (0.068) where ygrowth is quarterly growth of real GDP, mgrowth is quarterly growth of real money supply (M2), and ggrowth is quarterly growth of real government expenditures. "d" in front of ggrowth and mgrowth indicates a change in the variable. a. Assuming that money and government expenditures are exogenous, what do the coefficients represent? Calculate the h-period cumulative dynamic multipliers from these (fill-in the table below). How can you test for the statistical significance of the cumulative dynamic multipliers and the long- run cumulative dynamic multiplier? Lag number Monetary Monetary Fiscal Fiscal Cumulative Cumulative Dynamic Dynamic Multiplier Multiplier Multiplier Multiplier 0 1 2 3 4 Question 3 10 pts Your textbook states that there "are three ways to decide if two variables can plausibly be modeled as cointegrated: use expert knowledge and economic theory, graph the series and see whether they appear to have a common stochastic trend, and perform statistical tests for cointegration. All three ways should be used in practice." Accordingly you set out to check whether (the log of) consumption and (the log of) personal disposable income are cointegrated. You collect data for the sample period 1962:1 to 1995:IV and plot the two variables. 6000 5000 4000 3000 2000 1000 65 70 75 80 85 90 95 RCONS RYDP a. Using the first two methods to examine the series for cointegration, what do you think the likely answer is?
Step by Step Solution
There are 3 Steps involved in it
Step: 1

Get Instant Access to Expert-Tailored Solutions
See step-by-step solutions with expert insights and AI powered tools for academic success
Step: 2

Step: 3

Ace Your Homework with AI
Get the answers you need in no time with our AI-driven, step-by-step assistance
Get Started


