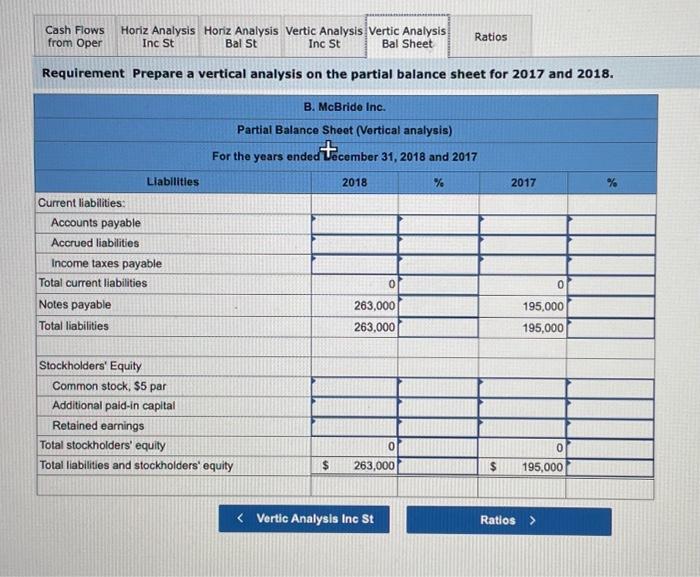
a) please help with the Partial Balance sheet (vertical Analysis)
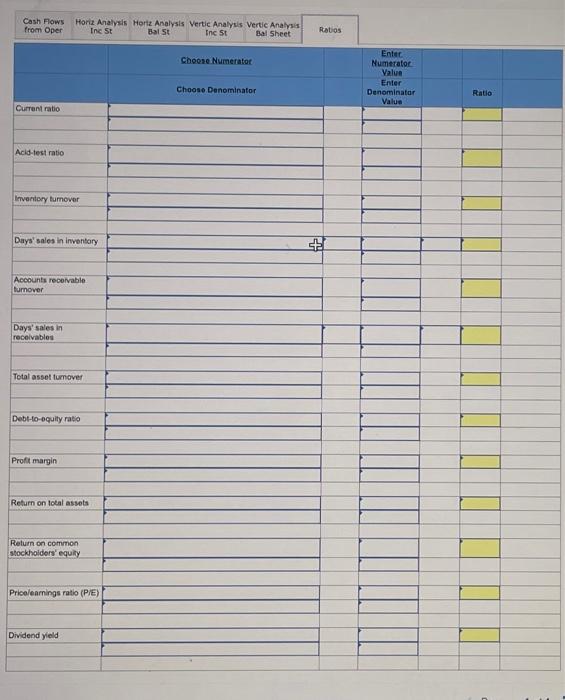
b) please help with the ratios section
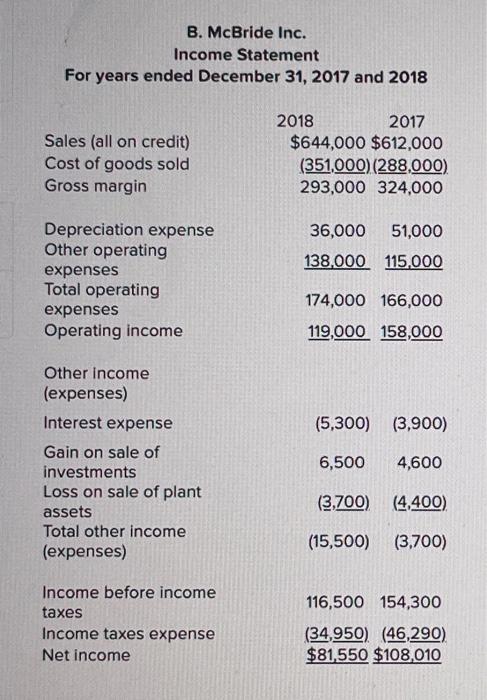
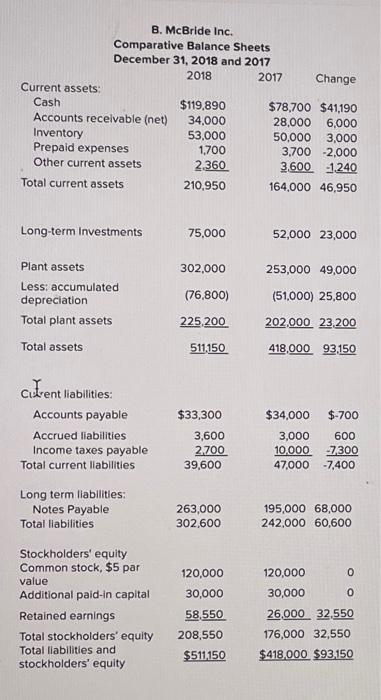
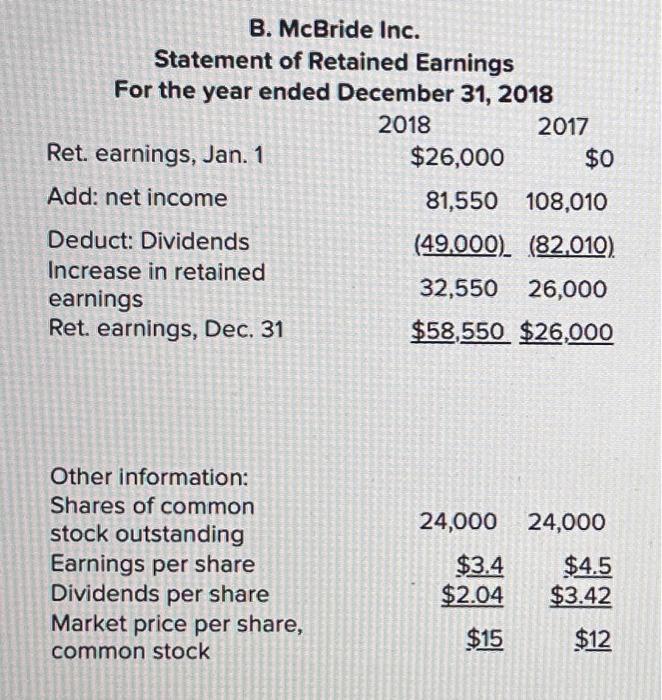
B. McBride Inc. Income Statement For years ended December 31, 2017 and 2018 Sales (all on credit) Cost of goods sold Gross margin Depreciation expense Other operating expenses Total operating expenses Operating income Other income (expenses) Interest expense Gain on sale of investments Loss on sale of plant assets Total other income (expenses) Income before income taxes Income taxes expense Net income \begin{tabular}{rc} 2018 & 2017 \\ $644,000 & $612,000 \\ (293351,000,000) & (324,000288,000) \\ 36,000 & 51,000 \\ 138,000 & 115,000 \\ \hline 174,000 & 166,000 \\ 119,000 & 158,000 \\ \hline \end{tabular} (5,300)6,500(3,700)(15,500)(3,900)4,600(4,400)(3,700) 116,500154,300 (34,950).(46,290) $81,550$108,010 B. McBride Inc. Comparative Balance Sheets December 31, 2018 and 2017 Current assets: Cash Accounts receivable (net) Inventory Prepaid expenses Other current assets Total current assets Long-term Investments Plant assets Less: accumulated depreciation Total plant assets Total assets Cutrent liabilities: Accounts payable Accrued liabilities Income taxes payable Total current llabilities Long term liabilities: Notes Payable Total liabilities Stockholders' equity Common stock, \$5 par value Additional paid-in capital Retained earnings Total stockholders' equity Total liabilities and stockholders' equity 2018 $119.890 34.000 53,000 1,700 2,360 210,950 75,000 302,000 (76,800) 225,200 511.150 $33,300 3,600 2,700 39,600 263,000 302,600 120,000 30,000 58,550 208,550 $511,150 2017 $78,700$41,190 28,0006,000 50,0003,000 3,7002,000 3,6001.240 164,00046,950 52,00023,000 253,00049,000 (51,000) 25,800 202,00023,200 418,00093,150 $34,000$700 3,000 600 47,00010,0007,4007,300 195,00068,000 242,00060,600 120,0000 30,000 0 26,00032,550 176,00032,550 $418,000$93,150 B. McBride Inc. Statement of Retained Earnings For the year ended December 31, 2018 \begin{tabular}{rr} 2018 & 2017 \\ $26,000 & $0 \\ 81,550 & 108,010 \\ (49,000) & (82,010) \\ 32,550 & 26,000 \\ $58,550 & $26,000 \\ \hline \end{tabular} Other information: Shares of common stock outstanding Earnings per share Dividends per share Market price per share, common stock 24,00024,000 $15$12 Requirement Prepare a vertical analysis on the partial balance sheet for 2017 and 2018
