Answered step by step
Verified Expert Solution
Question
1 Approved Answer
A portfolio is composed of two stocks, A and B. Stock A has a standard deviation of return of 5% while stock B has


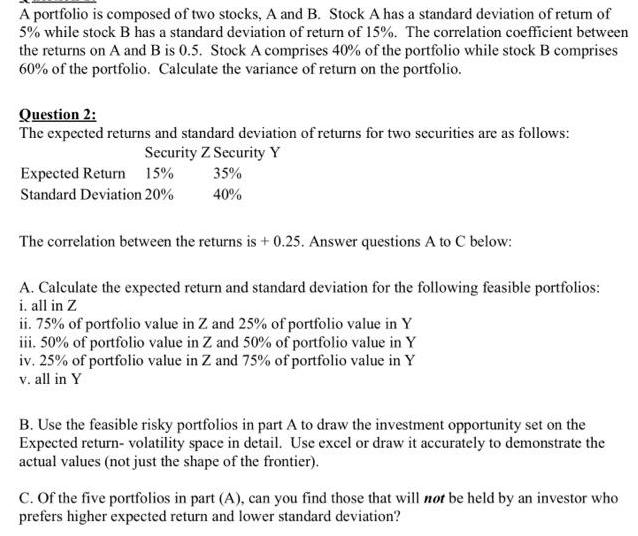
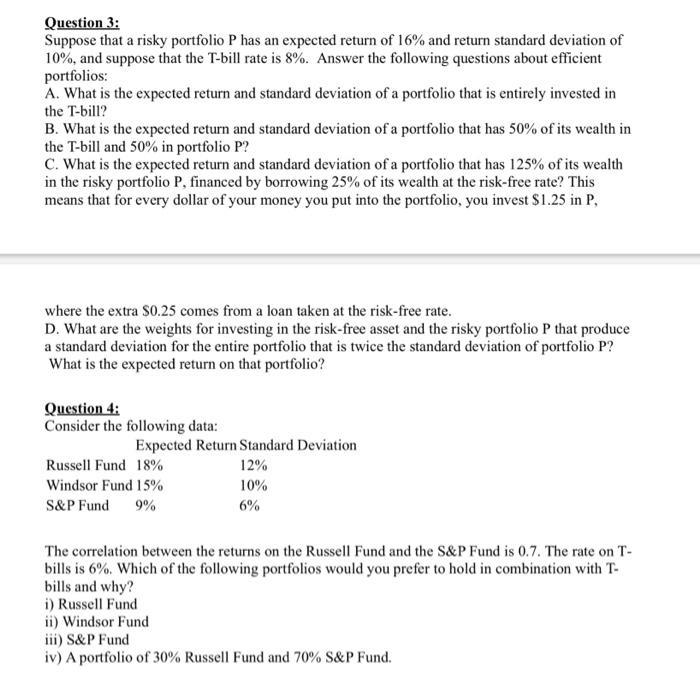
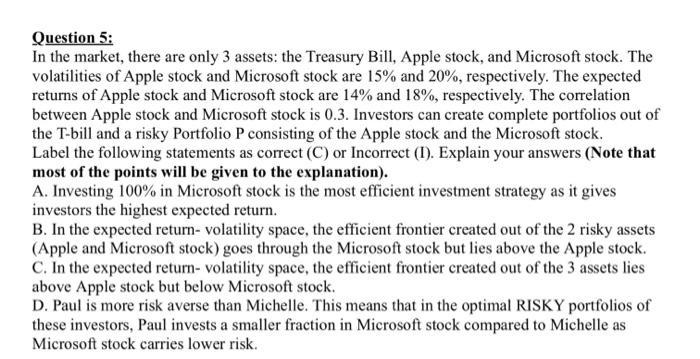
A portfolio is composed of two stocks, A and B. Stock A has a standard deviation of return of 5% while stock B has a standard deviation of return of 15%. The correlation coefficient between the returns on A and B is 0.5. Stock A comprises 40% of the portfolio while stock B comprises 60% of the portfolio. Calculate the variance of return on the portfolio. Question 2: The expected returns and standard deviation of returns for two securities are as follows: Security Z Security Y Expected Return 15% 35% Standard Deviation 20% 40% The correlation between the returns is + 0.25. Answer questions A to C below: A. Calculate the expected return and standard deviation for the following feasible portfolios: i. all in Z ii. 75% of portfolio value in Z and 25% of portfolio value in Y iii. 50% of portfolio value in Z and 50% of portfolio value in Y iv. 25% of portfolio value in Z and 75% of portfolio value in Y v. all in Y B. Use the feasible risky portfolios in part A to draw the investment opportunity set on the Expected return-volatility space in detail. Use excel or draw it accurately to demonstrate the actual values (not just the shape of the frontier). C. Of the five portfolios in part (A), can you find those that will not be held by an investor who prefers higher expected return and lower standard deviation? Question 3: Suppose that a risky portfolio P has an expected return of 16% and return standard deviation of 10%, and suppose that the T-bill rate is 8%. Answer the following questions about efficient portfolios: A. What is the expected return and standard deviation of a portfolio that is entirely invested in the T-bill? B. What is the expected return and standard deviation of a portfolio that has 50% of its wealth in the T-bill and 50% in portfolio P? C. What is the expected return and standard deviation of a portfolio that has 125% of its wealth in the risky portfolio P, financed by borrowing 25% of its wealth at the risk-free rate? This means that for every dollar of your money you put into the portfolio, you invest $1.25 in P, where the extra $0.25 comes from a loan taken at the risk-free rate. D. What are the weights for investing in the risk-free asset and the risky portfolio P that produce a standard deviation for the entire portfolio that is twice the standard deviation of portfolio P? What is the expected return on that portfolio? Question 4: Consider the following data: Expected Return Standard Deviation Russell Fund 18% 12% Windsor Fund 15% S&P Fund 10% 9% 6% The correlation between the returns on the Russell Fund and the S&P Fund is 0.7. The rate on T- bills is 6%. Which of the following portfolios would you prefer to hold in combination with T- bills and why? i) Russell Fund ii) Windsor Fund iii) S&P Fund iv) A portfolio of 30% Russell Fund and 70% S&P Fund. Question 5: In the market, there are only 3 assets: the Treasury Bill, Apple stock, and Microsoft stock. The volatilities of Apple stock and Microsoft stock are 15% and 20%, respectively. The expected returns of Apple stock and Microsoft stock are 14% and 18%, respectively. The correlation between Apple stock and Microsoft stock is 0.3. Investors can create complete portfolios out of the T-bill and a risky Portfolio P consisting of the Apple stock and the Microsoft stock. Label the following statements as correct (C) or Incorrect (I). Explain your answers (Note that most of the points will be given to the explanation). A. Investing 100% in Microsoft stock is the most efficient investment strategy as it gives investors the highest expected return. B. In the expected return- volatility space, the efficient frontier created out of the 2 risky assets (Apple and Microsoft stock) goes through the Microsoft stock but lies above the Apple stock. C. In the expected return- volatility space, the efficient frontier created out of the 3 assets lies above Apple stock but below Microsoft stock. D. Paul is more risk averse than Michelle. This means that in the optimal RISKY portfolios of these investors, Paul invests a smaller fraction in Microsoft stock compared to Michelle as Microsoft stock carries lower risk.
Step by Step Solution
There are 3 Steps involved in it
Step: 1

Get Instant Access to Expert-Tailored Solutions
See step-by-step solutions with expert insights and AI powered tools for academic success
Step: 2

Step: 3

Ace Your Homework with AI
Get the answers you need in no time with our AI-driven, step-by-step assistance
Get Started


