Answered step by step
Verified Expert Solution
Question
1 Approved Answer
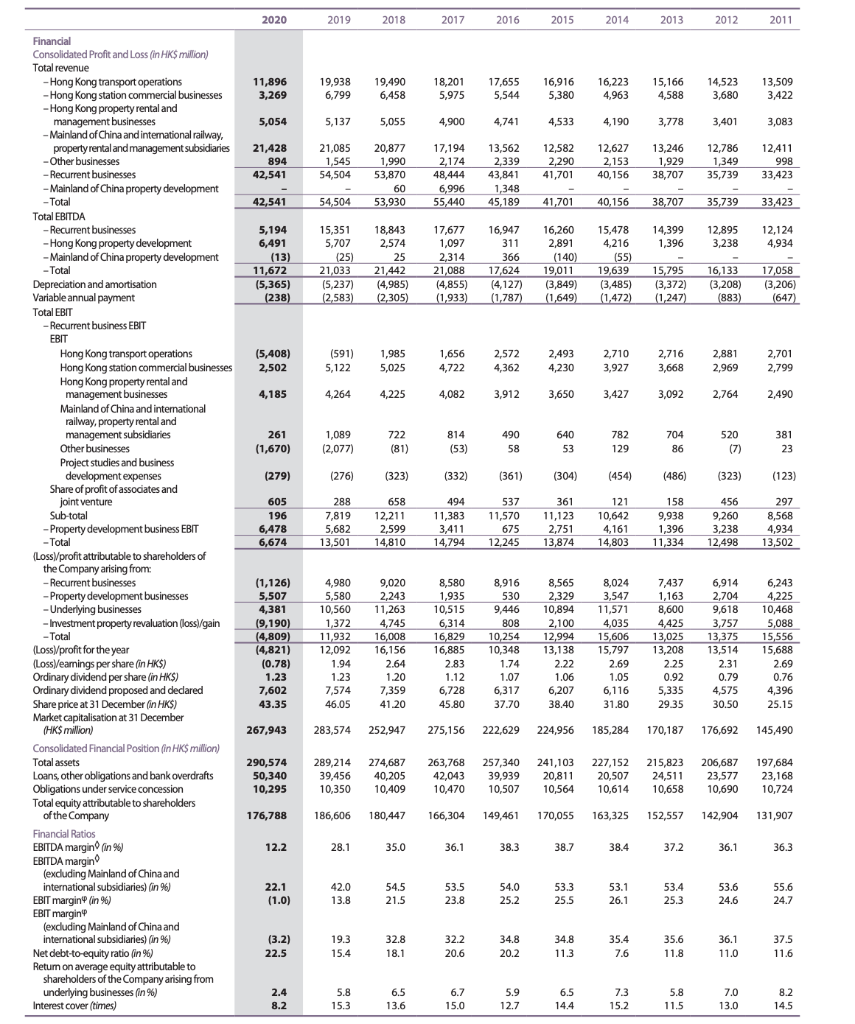
A quantitative analysis covering ALL of the following areas: a. Vertical analysis for 5 years b. Horizontal analysis for 5 years c. Financial ratio analysis


A quantitative analysis covering ALL of the following areas:
a. Vertical analysis for 5 years
b. Horizontal analysis for 5 years
c. Financial ratio analysis for 5 years
d. Valuation on its stock
e. Valuation on its bond (if company issued any bond)
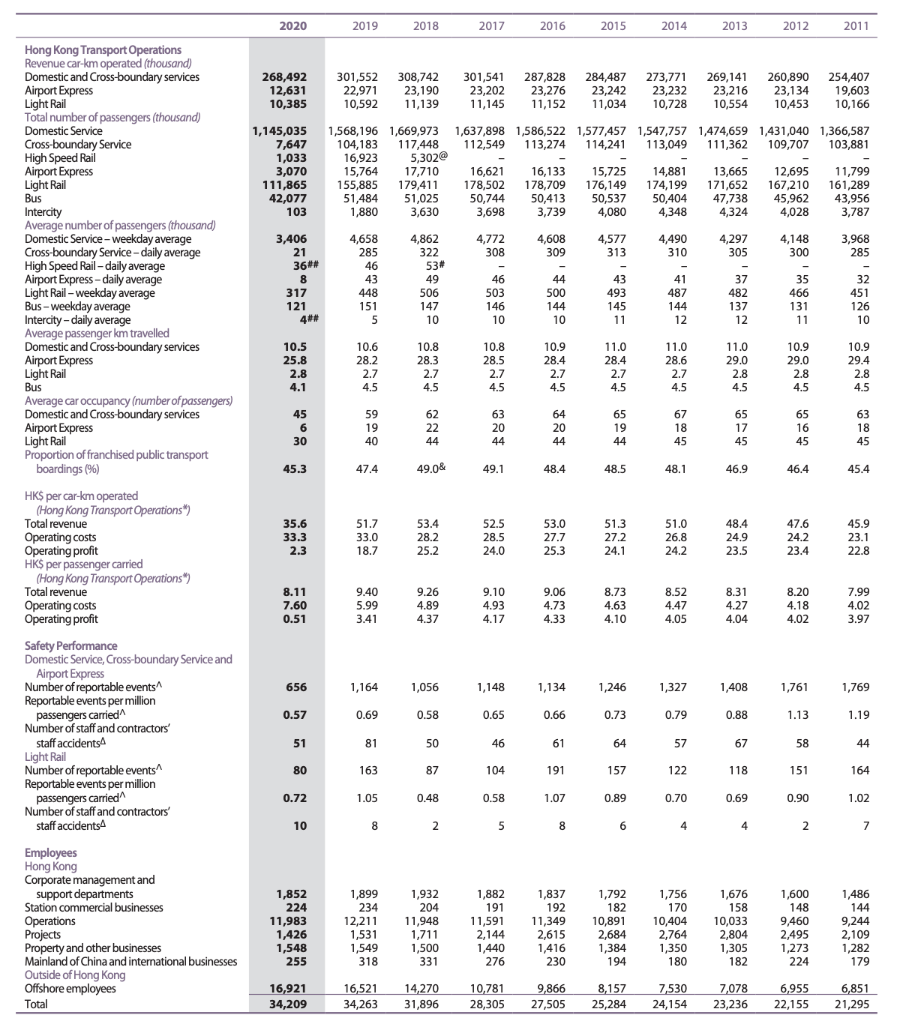
2020 2019 2018 2017 2016 2015 2014 2013 2012 2011 11,896 3,269 19,938 6,799 19,490 6,458 18,201 5,975 17,655 5,544 16,916 5,380 16,223 4,963 15,166 4,588 14,523 3,680 13,509 3,422 5,054 5,137 5,055 4,900 4,741 4,533 4,190 3,778 3,401 3,083 21,428 894 42,541 21,085 1,545 54,504 20,877 1,990 53,870 60 53,930 17,194 2,174 48,444 6,996 55,440 13,562 2,339 43,841 1,348 45,189 12,582 2,290 41,701 12,627 2,153 40,156 13,246 1,929 38,707 12,786 1,349 35,739 12,411 998 33,423 42,541 54,504 41,701 40,156 38,707 35,739 33,423 14,399 1,396 12,895 3,238 12,124 4,934 5,194 6,491 (13) 11,672 (5,365) (238) 15,351 5,707 (25) 21,033 (5,237) (2,583) 18,843 2,574 25 21,442 (4,985) (2,305) 17,677 1,097 2,314 21,088 (4,855) (1,933) 16,947 311 366 17,624 (4,127) (1,787) 16,260 2,891 (140) 19,011 (3,849) (1,649) 15,478 4,216 (55) 19,639 (3,485) (1.472) 15,795 (3,372) (1,247) 16,133 (3,208) (883) 17,058 (3,206) (647) 2,493 (5,408) ( 2,502 (591) 5,122 1,985 5,025 1,656 4,722 2,572 4,362 2,710 3,927 2,716 3,668 2,881 2,969 2,701 2,799 4,230 4,185 4,264 4,225 4,082 3,912 3,650 3,427 3,092 2,764 2,490 261 (1,670) 1,089 (2,077) 722 (81) ) 814 (53) 490 58 640 53 782 129 704 86 520 (7) 381 23 (279) (276) (323) (332) (361) (304) (454) (486) (323) (123) Financial Consolidated Profit and Loss (in HK$ million) Total revenue - Hong Kong transport operations - Hong Kong station commercial businesses - Hong Kong property rental and management businesses - Mainland of China and international railway, property rental and management subsidiaries -Other businesses - Recurrent businesses - Mainland of China property development - Total Total EBITDA -Recurrent businesses - Hong Kong property development - Mainland of China property development -Total Depreciation and amortisation Variable annual payment Total EBIT - Recurrent business EBIT EBIT Hong Kong transport operations Hong Kong station commercial businesses Hong Kong property rental and management businesses Mainland of China and international railway, property rental and management subsidiaries Other businesses Project studies and business development expenses Share of profit of associates and joint venture Sub-total - Property development business EBIT -Total (Loss profit attributable to shareholders of the Company arising from: -Recurrent businesses - Property development businesses - Underlying businesses - Investment property revaluation (loss//gain (Loss)profit for the year (LossWearings per share (in HK$) Ordinary dividend per share (in HKS) Ordinary dividend proposed and declared Share price at 31 December (in HKS) Market capitalisation at 31 December (HK$ million) Consolidated Financial Position (in HK$ million) Total assets Loans, other obligations and bank overdrafts Obligations under service concession Total equity attributable to shareholders of the Company Financial Ratios EBITDA margino (in %) EBITDA margin (excluding Mainland of China and international subsidiaries) (in %) EBIT margin (in %6) EBIT margin (excluding Mainland of China and international subsidiaries) (in %) Net debt-to-equity ratio (in %) Return on average equity attributable to shareholders of the Company arising from underlying businesses (in %) Interest cover times) 605 196 6,478 6,674 288 7,819 5,682 13,501 658 12,211 2,599 14,810 494 11,383 3,411 14,794 537 11,570 675 12,245 361 11,123 2,751 13,874 121 10,642 4,161 14,803 158 9.938 1,396 11,334 456 9,260 3,238 12,498 297 8,568 4,934 13,502 . - Total (1,126) 5,507 4,381 (9,190) (4,809) (4,821) (0.78) 1.23 7,602 43.35 4.980 5,580 10,560 1,372 11,932 12,092 1.94 1.23 7,574 46.05 9,020 2,243 11,263 4,745 16,008 16,156 2.64 1.20 7,359 41.20 8,580 1,935 10,515 6,314 16,829 16,885 2.83 1.12 6,728 45.80 8,916 530 9,446 808 10,254 10,348 1.74 1.07 6,317 37.70 8,565 2,329 10,894 2,100 12,994 13,138 2.22 1.06 6,207 38.40 8,024 3,547 11,571 4,035 15,606 15.797 2.69 1.05 6,116 31.80 7,437 1,163 8,600 4,425 13,025 13,208 2.25 0.92 5,335 29.35 6,914 2,704 9,618 3,757 13,375 13,514 2.31 0.79 4,575 30.50 6,243 4,225 10,468 5,088 15,556 15,688 2.69 0.76 4,396 25.15 267,943 283,574 252,947 275,156 222,629 224,956 185,284 170,187 176,692 145,490 290,574 50,340 10,295 289,214 39,456 10,350 274,687 40,205 10,409 263,768 42,043 10,470 257,340 39.939 10,507 241,103 20,811 10,564 227,152 20,507 10,614 215,823 24,511 10,658 206,687 23,577 10,690 197,684 23,168 10,724 176,788 186,606 180,447 166,304 149,461 170,055 163,325 152.557 142,904 131,907 12.2 28.1 35.0 36.1 38.3 38.7 38.4 37.2 36.1 36.3 22.1 (1.0) 42.0 13.8 54.5 21.5 53.5 23.8 54.0 25.2 53.3 25.5 53.1 26.1 53.4 25.3 53.6 24.6 55.6 24.7 (3.2) 22.5 19.3 15.4 32.8 18.1 32.2 20.6 34.8 20.2 34.8 11.3 35.4 7.6 35.6 11.8 36.1 11.0 37.5 11.6 7.0 2.4 8.2 5.8 15.3 6.5 13.6 6.7 15.0 5.9 12.7 6.5 14.4 73 15.2 5.8 11.5 8.2 14.5 13.0 2020 2019 2018 2017 2016 2015 2014 2013 2012 2011 268,492 12,631 10,385 301,552 22,971 10,592 308,742 23,190 11,139 301,541 23,202 11,145 287,828 23,276 11,152 284,487 23,242 11,034 273,771 23,232 10,728 269,141 23,216 10,554 260,890 254,407 23,134 19,603 10,453 10,166 1,145,035 7,647 1,033 3,070 111,865 42,077 103 1,568,196 1,669,973 1,637,898 1,586,522 1,577,457 1,547,757 1,474,659 1,431,040 1,366,587 104,183 117,448 112,549 113,274 114,241 113,049 111,362 109,707 103,881 16,923 5,302@ 15,764 17,710 16,621 16,133 15,725 14,881 13,665 12,695 11,799 155,885 179,411 178,502 178,709 176,149 174,199 171,652 167,210 161,289 51,484 51,025 50,744 50,413 50,537 50,404 47,738 45,962 43,956 1,880 3,630 3,698 3,739 4,080 4,348 4,324 4,028 3,787 4,608 4,490 3,406 21 36## 4,658 285 4,772 308 4,577 313 4,148 300 Hong Kong Transport Operations Revenue car-km operated (thousand) Domestic and Cross-boundary services Airport Express Light Rail Total number of passengers (thousand) Domestic Service Cross-boundary Service High Speed Rail Airport Express Light Rail Bus Intercity Average number of passengers (thousand) Domestic Service-weekday average Cross boundary Service-daily average High Speed Rail-daily average Airport Express - daily average Light Rail - Weekday average Bus-weekday average Intercity - daily average Average passenger km travelled Domestic and Cross-boundary services Airport Express Light Rail Bus Average car occupancy (number of passengers) Domestic and Cross-boundary services Airport Express Light Rail Proportion of franchised public transport boardings (96) 3,968 285 * 82 4,862 322 53# 49 506 147 10 4,297 305 - 37 482 137 12 317 121 4## 46 503 146 10 '' = 448 151 493 145 466 131 -- 32 451 126 10 eg 10.8 28.3 '' '' = '' e 10.5 25.8 2.8 4.1 10.6 28.2 2.7 4.5 10.8 28.5 2.7 4.5 10.9 28.4 11.0 28.6 11.0 28.4 2.7 11.0 29.0 2.8 4.5 10.9 29.0 2.8 4.5 10.9 29.4 2.8 4.5 2.7 4.5 45 62 22 44 63 20 44 65 17 45 63 18 45 30 45.3 47.4 49.0& 49.1 48.4 48.5 48.1 46.9 46.4 45.4 35.6 33.3 2.3 51.7 33.0 18.7 53.4 28.2 25.2 52.5 28.5 24.0 53.0 27.7 25.3 51.3 27.2 24.1 51.0 26.8 24.2 48,4 24.9 23.5 47.6 24.2 23.4 45.9 23.1 22.8 HK$ per car-km operated (Hong Kong Transport Operations) Total revenue Operating costs Operating profit HK$ per passenger carried (Hong Kong Transport Operations) Total revenue Operating costs Operating profit 8.11 7.60 0.51 9.40 5.99 3.41 9.26 4.89 4.37 9.10 4.93 4.17 9.06 4.73 4.33 8.73 4.63 4.10 8.52 4.47 4.05 8.31 4.27 4.04 8.20 4.18 4.02 7.99 4.02 3.97 656 1,164 1,056 1,148 1,134 1,246 1,327 1,408 1,761 1,769 0.57 0.69 0.58 0.65 0.66 0.73 0.79 0.88 1.13 1.19 Safety Performance Domestic Service, Cross-boundary Service and Airport Express Number of reportable events Reportable events per million passengers carried Number of staff and contractors staff accidents Light Rail Number of reportable events Reportable events per million passengers carried Number of staff and contractors staff accidents 51 81 50 46 61 64 57 67 58 44 80 163 87 104 191 157 122 118 151 164 1.05 0.48 0.58 1.07 0.89 0.70 0.69 0.90 1.02 0.72 10 8 2 5 8 6 4 4 2 2 7 Employees Hong Kong Corporate management and support departments Station commercial businesses Operations Projects Property and other businesses Mainland of China and international businesses Outside of Hong Kong Offshore employees Total 1,852 224 11,983 1,426 1,548 255 1,899 234 12,211 1,531 1,549 318 1,932 204 11,948 1,711 1,500 331 1,882 191 11,591 2,144 1,440 276 1,837 192 11,349 2,615 1,416 230 1,792 182 10,891 2,684 1,384 194 1,756 170 10,404 2,764 1,350 180 1,676 158 10,033 2,804 1,305 182 1,600 148 9,460 2,495 1,273 224 1,486 144 9,244 2,109 1,282 179 16,921 34,209 16,521 34,263 14,270 31,896 10,781 28,305 9,866 27,505 8,157 25,284 7,530 24,154 7,078 23,236 6,955 22,155 6,851 21,295 2020 2019 2018 2017 2016 2015 2014 2013 2012 2011 11,896 3,269 19,938 6,799 19,490 6,458 18,201 5,975 17,655 5,544 16,916 5,380 16,223 4,963 15,166 4,588 14,523 3,680 13,509 3,422 5,054 5,137 5,055 4,900 4,741 4,533 4,190 3,778 3,401 3,083 21,428 894 42,541 21,085 1,545 54,504 20,877 1,990 53,870 60 53,930 17,194 2,174 48,444 6,996 55,440 13,562 2,339 43,841 1,348 45,189 12,582 2,290 41,701 12,627 2,153 40,156 13,246 1,929 38,707 12,786 1,349 35,739 12,411 998 33,423 42,541 54,504 41,701 40,156 38,707 35,739 33,423 14,399 1,396 12,895 3,238 12,124 4,934 5,194 6,491 (13) 11,672 (5,365) (238) 15,351 5,707 (25) 21,033 (5,237) (2,583) 18,843 2,574 25 21,442 (4,985) (2,305) 17,677 1,097 2,314 21,088 (4,855) (1,933) 16,947 311 366 17,624 (4,127) (1,787) 16,260 2,891 (140) 19,011 (3,849) (1,649) 15,478 4,216 (55) 19,639 (3,485) (1.472) 15,795 (3,372) (1,247) 16,133 (3,208) (883) 17,058 (3,206) (647) 2,493 (5,408) ( 2,502 (591) 5,122 1,985 5,025 1,656 4,722 2,572 4,362 2,710 3,927 2,716 3,668 2,881 2,969 2,701 2,799 4,230 4,185 4,264 4,225 4,082 3,912 3,650 3,427 3,092 2,764 2,490 261 (1,670) 1,089 (2,077) 722 (81) ) 814 (53) 490 58 640 53 782 129 704 86 520 (7) 381 23 (279) (276) (323) (332) (361) (304) (454) (486) (323) (123) Financial Consolidated Profit and Loss (in HK$ million) Total revenue - Hong Kong transport operations - Hong Kong station commercial businesses - Hong Kong property rental and management businesses - Mainland of China and international railway, property rental and management subsidiaries -Other businesses - Recurrent businesses - Mainland of China property development - Total Total EBITDA -Recurrent businesses - Hong Kong property development - Mainland of China property development -Total Depreciation and amortisation Variable annual payment Total EBIT - Recurrent business EBIT EBIT Hong Kong transport operations Hong Kong station commercial businesses Hong Kong property rental and management businesses Mainland of China and international railway, property rental and management subsidiaries Other businesses Project studies and business development expenses Share of profit of associates and joint venture Sub-total - Property development business EBIT -Total (Loss profit attributable to shareholders of the Company arising from: -Recurrent businesses - Property development businesses - Underlying businesses - Investment property revaluation (loss//gain (Loss)profit for the year (LossWearings per share (in HK$) Ordinary dividend per share (in HKS) Ordinary dividend proposed and declared Share price at 31 December (in HKS) Market capitalisation at 31 December (HK$ million) Consolidated Financial Position (in HK$ million) Total assets Loans, other obligations and bank overdrafts Obligations under service concession Total equity attributable to shareholders of the Company Financial Ratios EBITDA margino (in %) EBITDA margin (excluding Mainland of China and international subsidiaries) (in %) EBIT margin (in %6) EBIT margin (excluding Mainland of China and international subsidiaries) (in %) Net debt-to-equity ratio (in %) Return on average equity attributable to shareholders of the Company arising from underlying businesses (in %) Interest cover times) 605 196 6,478 6,674 288 7,819 5,682 13,501 658 12,211 2,599 14,810 494 11,383 3,411 14,794 537 11,570 675 12,245 361 11,123 2,751 13,874 121 10,642 4,161 14,803 158 9.938 1,396 11,334 456 9,260 3,238 12,498 297 8,568 4,934 13,502 . - Total (1,126) 5,507 4,381 (9,190) (4,809) (4,821) (0.78) 1.23 7,602 43.35 4.980 5,580 10,560 1,372 11,932 12,092 1.94 1.23 7,574 46.05 9,020 2,243 11,263 4,745 16,008 16,156 2.64 1.20 7,359 41.20 8,580 1,935 10,515 6,314 16,829 16,885 2.83 1.12 6,728 45.80 8,916 530 9,446 808 10,254 10,348 1.74 1.07 6,317 37.70 8,565 2,329 10,894 2,100 12,994 13,138 2.22 1.06 6,207 38.40 8,024 3,547 11,571 4,035 15,606 15.797 2.69 1.05 6,116 31.80 7,437 1,163 8,600 4,425 13,025 13,208 2.25 0.92 5,335 29.35 6,914 2,704 9,618 3,757 13,375 13,514 2.31 0.79 4,575 30.50 6,243 4,225 10,468 5,088 15,556 15,688 2.69 0.76 4,396 25.15 267,943 283,574 252,947 275,156 222,629 224,956 185,284 170,187 176,692 145,490 290,574 50,340 10,295 289,214 39,456 10,350 274,687 40,205 10,409 263,768 42,043 10,470 257,340 39.939 10,507 241,103 20,811 10,564 227,152 20,507 10,614 215,823 24,511 10,658 206,687 23,577 10,690 197,684 23,168 10,724 176,788 186,606 180,447 166,304 149,461 170,055 163,325 152.557 142,904 131,907 12.2 28.1 35.0 36.1 38.3 38.7 38.4 37.2 36.1 36.3 22.1 (1.0) 42.0 13.8 54.5 21.5 53.5 23.8 54.0 25.2 53.3 25.5 53.1 26.1 53.4 25.3 53.6 24.6 55.6 24.7 (3.2) 22.5 19.3 15.4 32.8 18.1 32.2 20.6 34.8 20.2 34.8 11.3 35.4 7.6 35.6 11.8 36.1 11.0 37.5 11.6 7.0 2.4 8.2 5.8 15.3 6.5 13.6 6.7 15.0 5.9 12.7 6.5 14.4 73 15.2 5.8 11.5 8.2 14.5 13.0 2020 2019 2018 2017 2016 2015 2014 2013 2012 2011 268,492 12,631 10,385 301,552 22,971 10,592 308,742 23,190 11,139 301,541 23,202 11,145 287,828 23,276 11,152 284,487 23,242 11,034 273,771 23,232 10,728 269,141 23,216 10,554 260,890 254,407 23,134 19,603 10,453 10,166 1,145,035 7,647 1,033 3,070 111,865 42,077 103 1,568,196 1,669,973 1,637,898 1,586,522 1,577,457 1,547,757 1,474,659 1,431,040 1,366,587 104,183 117,448 112,549 113,274 114,241 113,049 111,362 109,707 103,881 16,923 5,302@ 15,764 17,710 16,621 16,133 15,725 14,881 13,665 12,695 11,799 155,885 179,411 178,502 178,709 176,149 174,199 171,652 167,210 161,289 51,484 51,025 50,744 50,413 50,537 50,404 47,738 45,962 43,956 1,880 3,630 3,698 3,739 4,080 4,348 4,324 4,028 3,787 4,608 4,490 3,406 21 36## 4,658 285 4,772 308 4,577 313 4,148 300 Hong Kong Transport Operations Revenue car-km operated (thousand) Domestic and Cross-boundary services Airport Express Light Rail Total number of passengers (thousand) Domestic Service Cross-boundary Service High Speed Rail Airport Express Light Rail Bus Intercity Average number of passengers (thousand) Domestic Service-weekday average Cross boundary Service-daily average High Speed Rail-daily average Airport Express - daily average Light Rail - Weekday average Bus-weekday average Intercity - daily average Average passenger km travelled Domestic and Cross-boundary services Airport Express Light Rail Bus Average car occupancy (number of passengers) Domestic and Cross-boundary services Airport Express Light Rail Proportion of franchised public transport boardings (96) 3,968 285 * 82 4,862 322 53# 49 506 147 10 4,297 305 - 37 482 137 12 317 121 4## 46 503 146 10 '' = 448 151 493 145 466 131 -- 32 451 126 10 eg 10.8 28.3 '' '' = '' e 10.5 25.8 2.8 4.1 10.6 28.2 2.7 4.5 10.8 28.5 2.7 4.5 10.9 28.4 11.0 28.6 11.0 28.4 2.7 11.0 29.0 2.8 4.5 10.9 29.0 2.8 4.5 10.9 29.4 2.8 4.5 2.7 4.5 45 62 22 44 63 20 44 65 17 45 63 18 45 30 45.3 47.4 49.0& 49.1 48.4 48.5 48.1 46.9 46.4 45.4 35.6 33.3 2.3 51.7 33.0 18.7 53.4 28.2 25.2 52.5 28.5 24.0 53.0 27.7 25.3 51.3 27.2 24.1 51.0 26.8 24.2 48,4 24.9 23.5 47.6 24.2 23.4 45.9 23.1 22.8 HK$ per car-km operated (Hong Kong Transport Operations) Total revenue Operating costs Operating profit HK$ per passenger carried (Hong Kong Transport Operations) Total revenue Operating costs Operating profit 8.11 7.60 0.51 9.40 5.99 3.41 9.26 4.89 4.37 9.10 4.93 4.17 9.06 4.73 4.33 8.73 4.63 4.10 8.52 4.47 4.05 8.31 4.27 4.04 8.20 4.18 4.02 7.99 4.02 3.97 656 1,164 1,056 1,148 1,134 1,246 1,327 1,408 1,761 1,769 0.57 0.69 0.58 0.65 0.66 0.73 0.79 0.88 1.13 1.19 Safety Performance Domestic Service, Cross-boundary Service and Airport Express Number of reportable events Reportable events per million passengers carried Number of staff and contractors staff accidents Light Rail Number of reportable events Reportable events per million passengers carried Number of staff and contractors staff accidents 51 81 50 46 61 64 57 67 58 44 80 163 87 104 191 157 122 118 151 164 1.05 0.48 0.58 1.07 0.89 0.70 0.69 0.90 1.02 0.72 10 8 2 5 8 6 4 4 2 2 7 Employees Hong Kong Corporate management and support departments Station commercial businesses Operations Projects Property and other businesses Mainland of China and international businesses Outside of Hong Kong Offshore employees Total 1,852 224 11,983 1,426 1,548 255 1,899 234 12,211 1,531 1,549 318 1,932 204 11,948 1,711 1,500 331 1,882 191 11,591 2,144 1,440 276 1,837 192 11,349 2,615 1,416 230 1,792 182 10,891 2,684 1,384 194 1,756 170 10,404 2,764 1,350 180 1,676 158 10,033 2,804 1,305 182 1,600 148 9,460 2,495 1,273 224 1,486 144 9,244 2,109 1,282 179 16,921 34,209 16,521 34,263 14,270 31,896 10,781 28,305 9,866 27,505 8,157 25,284 7,530 24,154 7,078 23,236 6,955 22,155 6,851 21,295Step by Step Solution
There are 3 Steps involved in it
Step: 1

Get Instant Access to Expert-Tailored Solutions
See step-by-step solutions with expert insights and AI powered tools for academic success
Step: 2

Step: 3

Ace Your Homework with AI
Get the answers you need in no time with our AI-driven, step-by-step assistance
Get Started


