

Question
A random sample of 100 customers was chosen in UMUC MiniMart between 3:00 and 4:00 PM on a Friday afternoon. The frequency distribution below shows
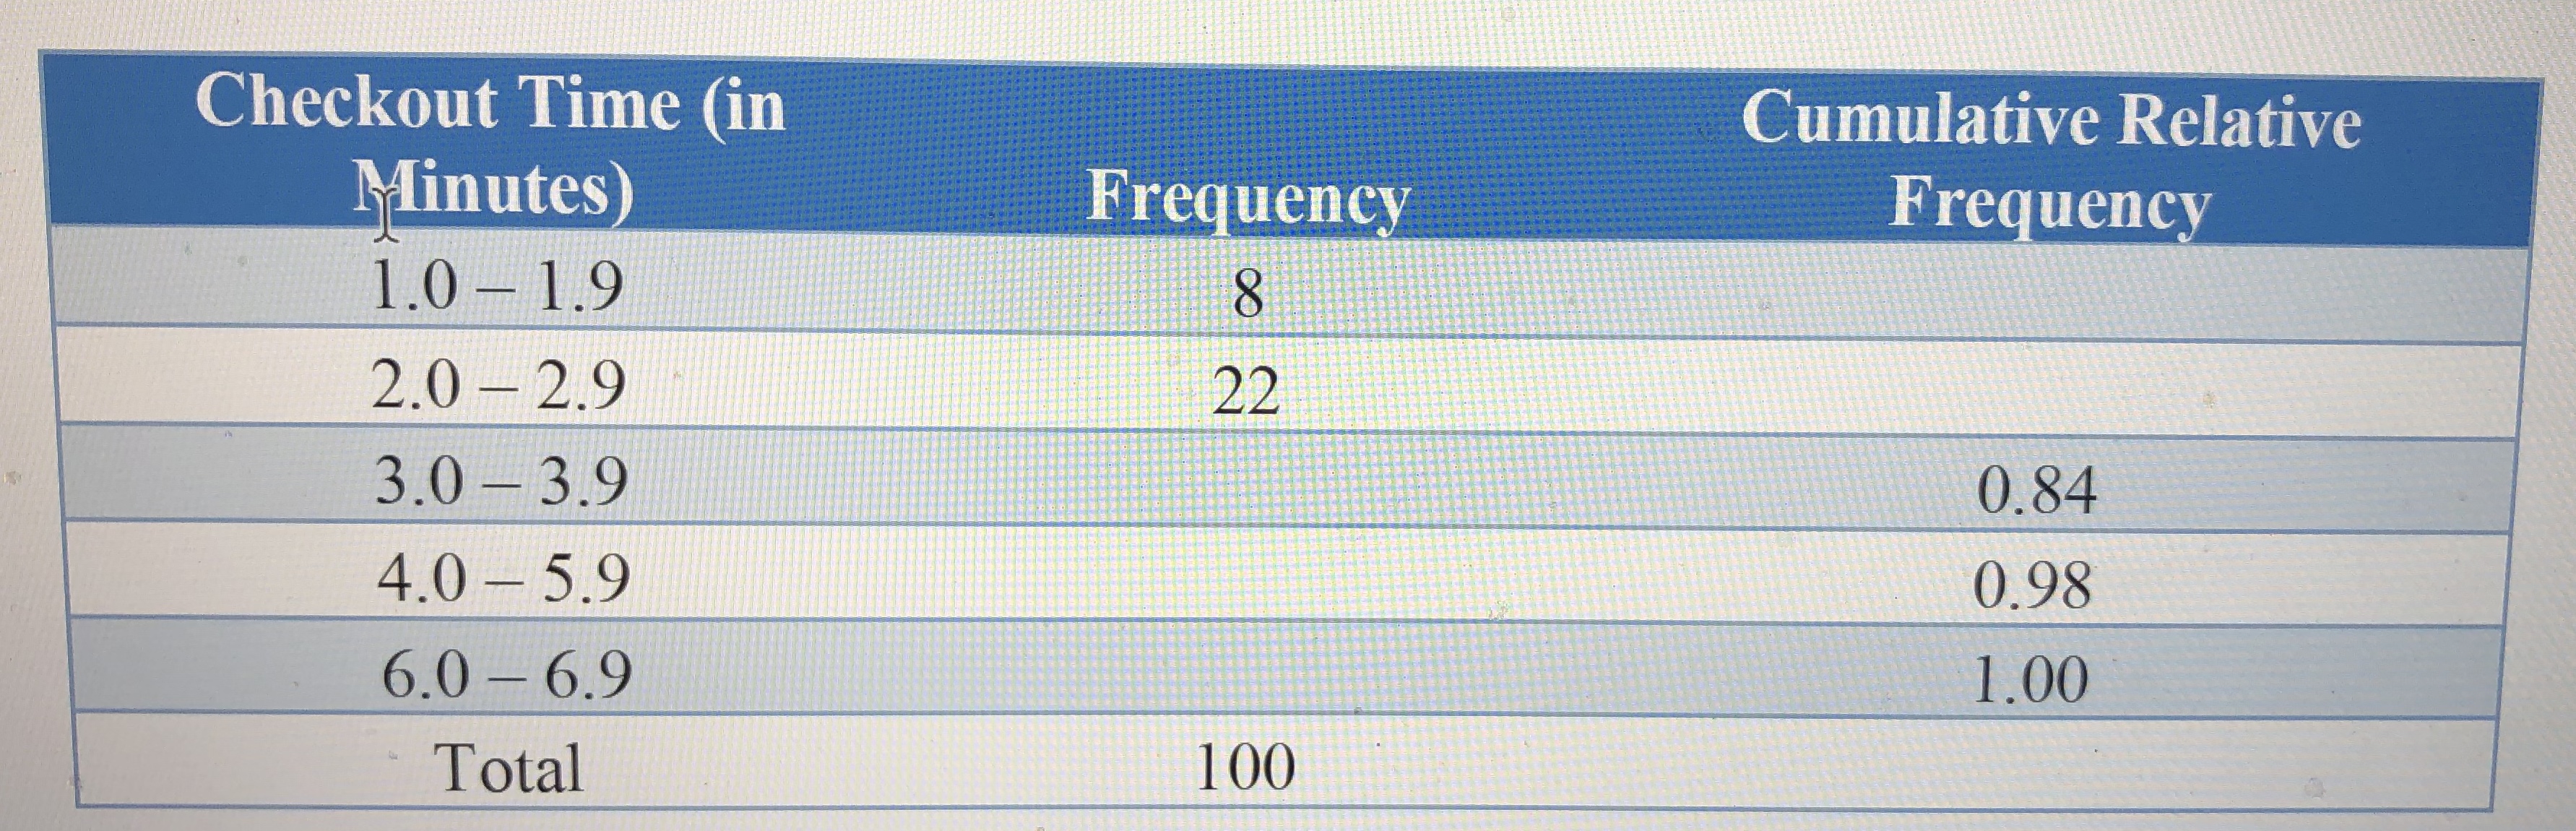
A random sample of 100 customers was chosen in UMUC MiniMart between 3:00 and 4:00 PM on a Friday afternoon. The frequency distribution below shows the distribution for checkout time (in minutes). (Show all work. Just the answer, without supporting work, will receive no credit.)
Checkout Time (in Minutes)/Frequency/ Cumulative Relative Frequency
1.0 -1.9 / 8 / blank
2.0 - 2.9 / 22/ blank
3.0 - 3.9 / blank / 0.84
4.0 - 5.9 / blank / 0.98
6.0 - 6.9 / blank / 1.0
total 100
- (a) Complete the frequency table with frequency and cumulative relative frequency. Express the cumulative relative frequency to two decimal places.
- (b) What percentage of the checkout times was less than 3 minutes?
- (c) Which of the following checkout time groups does the median of this distribution belong to? 1.0 - 1.9, 2.0 - 2.9, 3.0 - 3.9, 4.0 - 5.9, or 6.0 - 6.9? Why?
Step by Step Solution
There are 3 Steps involved in it
Step: 1

Get Instant Access to Expert-Tailored Solutions
See step-by-step solutions with expert insights and AI powered tools for academic success
Step: 2

Step: 3
Ace Your Homework with AI
Get the answers you need in no time with our AI-driven, step-by-step assistance
Get Started
Algebra and Trigonometry
Authors: Ron Larson
10th edition
9781337514255, 1337271179, 133751425X, 978-1337271172