Question
A randomized trial was performed to evaluate the effectiveness of a new drug on controlling Type I diabetes in teenagers. A random sample of 150
A randomized trial was performed to evaluate the effectiveness of a new drug on controlling Type I diabetes in teenagers. A random sample of 150 patients were obtained from the pediatric diabetes clinic at Sick Kids in Toronto, Ontario; 75 were randomly assigned to the treatment group (new drug) and 75 were randomly assigned to the control group (existing drug). You may assume that basic factors such as validity of the inclusion criteria, blinding, etc. were performed appropriately.
Baseline information such as age and gender were collected and key outcomes of A1C level and number of hypoglycemic events were measured after four weeks. A1C levels indicate what percentage of your hemoglobin is coated with sugar (glycated). Higher A1C levels indicate poorer blood sugar control and a higher risk for diabetes complications. A hypoglycemic event occurs when the plasma glucose levels become too low; this is a common and adverse effect of diabetes therapy which has been shown to negatively impact on quality of life.
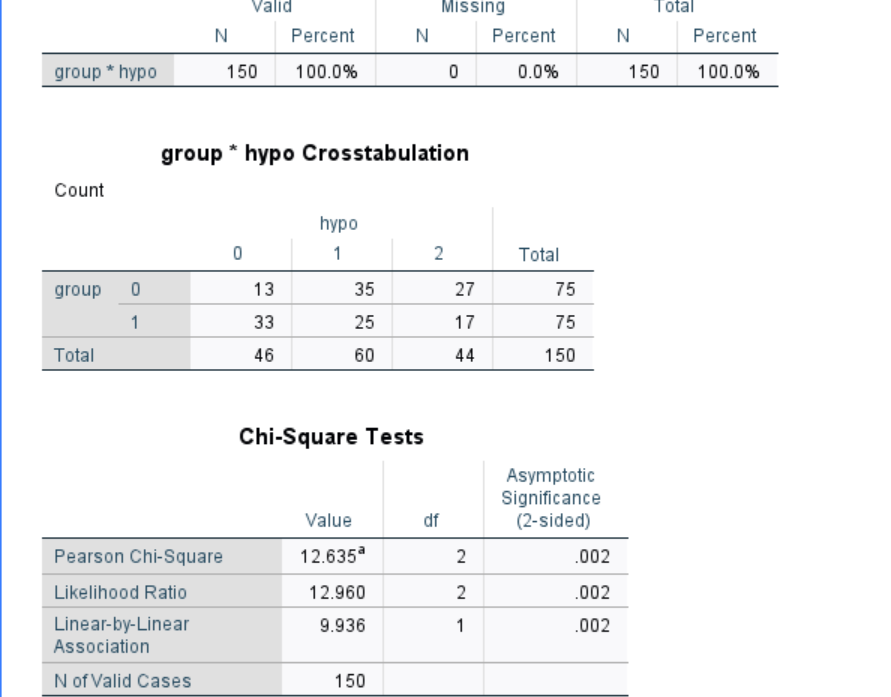
- Do the number of hypoglycemic events differ between the treatment and control groups? In other words, is there a statistically significant relationship between the number of hypoglycemic events and group (treatment and control)? Run the appropriate test at the 5% level of significance. ( Did a chi test , picture included)
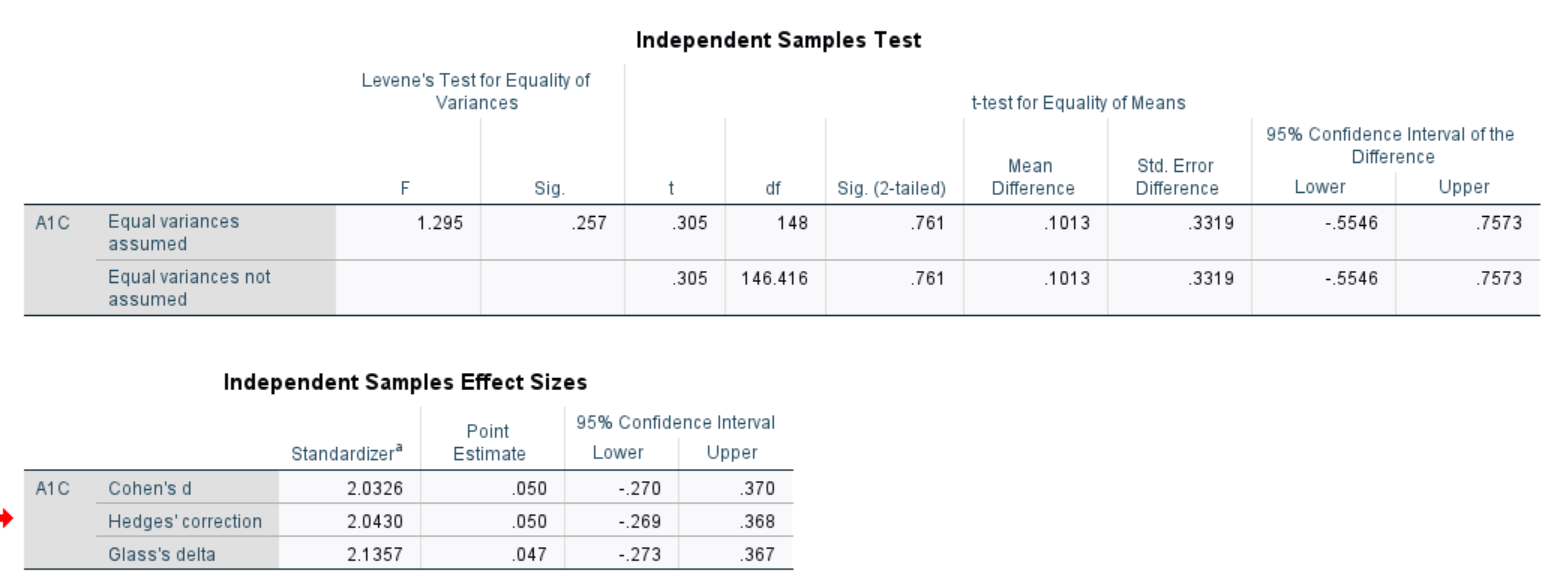
- Is there a statistically significant difference in A1C levels between the treatment and control groups? Run the appropriate test at the 5% level of significance and decide on a 1-tail or 2-tail test. ( did T-test of independed)
Which varaibles are categorical and contunous


Step by Step Solution
There are 3 Steps involved in it
Step: 1

Get Instant Access to Expert-Tailored Solutions
See step-by-step solutions with expert insights and AI powered tools for academic success
Step: 2

Step: 3

Ace Your Homework with AI
Get the answers you need in no time with our AI-driven, step-by-step assistance
Get Started


