Answered step by step
Verified Expert Solution
Link Copied!

Question

1 Approved Answer

A real estate investor would like to develop a regression model to predict the price of a house based on its characteristics (size, number of
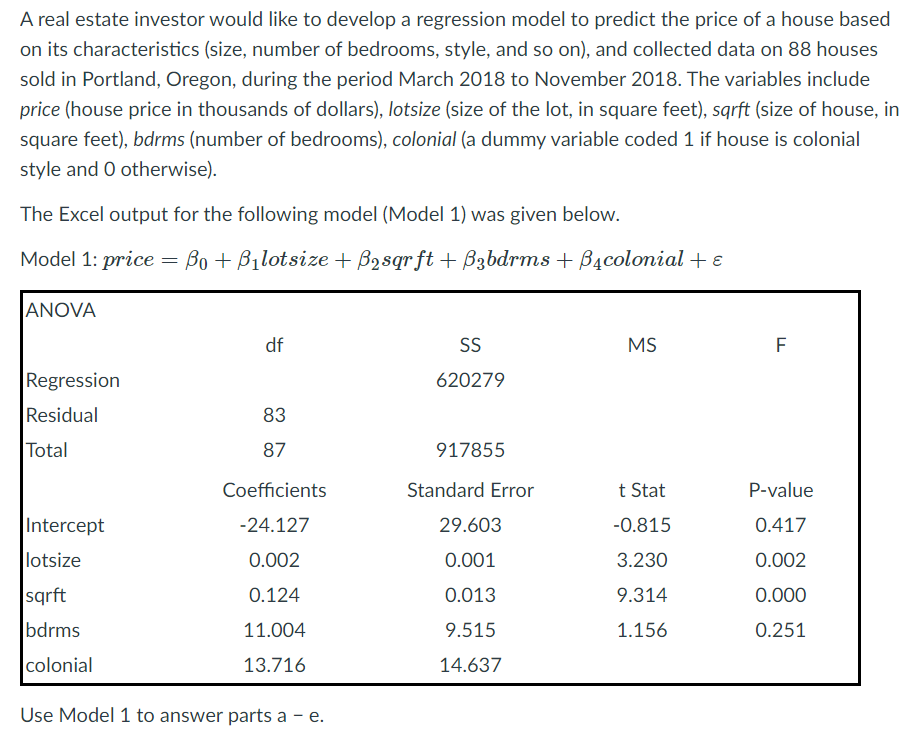
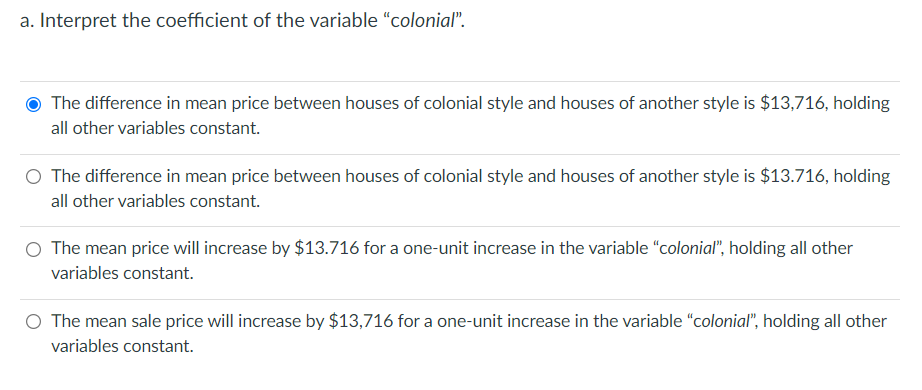
image text in transcribedimage text in transcribedimage text in transcribed

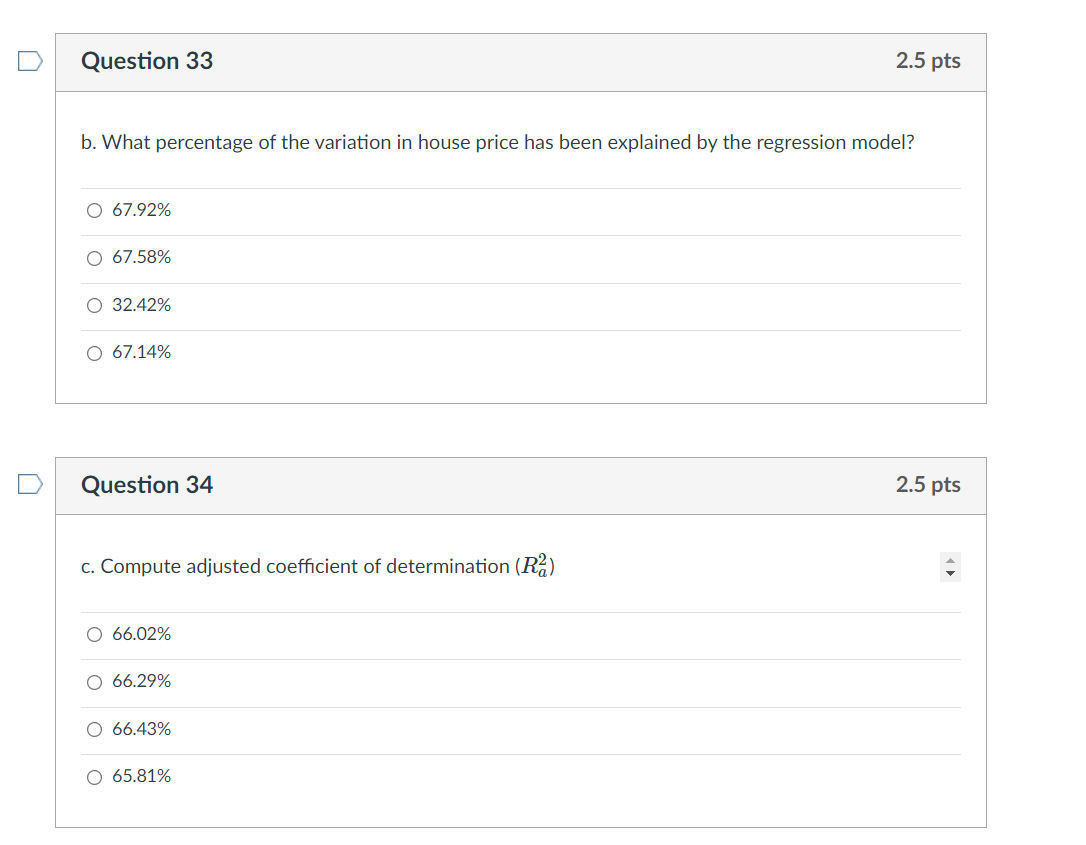
A real estate investor would like to develop a regression model to predict the price of a house based on its characteristics (size, number of bedrooms, style, and so on), and collected data on 88 houses sold in Portland, Oregon, during the period March 2018 to November 2018. The variables include price (house price in thousands of dollars), lotsize (size of the lot, in square feet), sarft (size of house, in square feet), bdrms (number of bedrooms), colonial (a dummy variable coded 1 if house is colonial style and O otherwise). The Excel output for the following model (Model 1) was given below. Model 1: price = Bo + Bilotsize + B2sqrft + B3bdrms + B4colonial + ANOVA df SS MS F Regression 620279 Residual 83 Total 87 917855 Coefficients Standard Error t Stat P-value Intercept -24.127 29.603 -0.815 0.417 0.002 0.001 3.230 0.002 lotsize sarft bdrms 0.124 0.013 9.314 0.000 11.004 9.515 1.156 0.251 colonial 13.716 14.637 Use Model 1 to answer parts a - e. a. Interpret the coefficient of the variable "colonial". The difference in mean price between houses of colonial style and houses of another style is $13,716, holding all other variables constant. The difference in mean price between houses of colonial style and houses of another style is $13.716, holding all other variables constant. The mean price will increase by $13.716 for a one-unit increase in the variable "colonial", holding all other variables constant. The mean sale price will increase by $13,716 for a one-unit increase in the variable colonial, holding all other variables constant. Question 33 2.5 pts b. What percentage of the variation in house price has been explained by the regression model? O 67.92% O 67.58% O 32.42% 0 67.14% Question 34 2.5 pts c. Compute adjusted coefficient of determination (R2) O 66.02% O 66.29% O 66.43% O 65.81%
Step by Step Solution

There are 3 Steps involved in it

Step: 1

blur-text-image

Get Instant Access to Expert-Tailored Solutions

See step-by-step solutions with expert insights and AI powered tools for academic success

Step: 2

blur-text-image_2

Step: 3

blur-text-image_3

Ace Your Homework with AI

Get the answers you need in no time with our AI-driven, step-by-step assistance

Get Started

Recommended Textbook for

Passive Income A Guide To Building Passive Income Streams

Authors: Yun Jin Xu

1st Edition

979-8866884490

More Books

Students also viewed these Finance questions

Question

What are your leadership objectives?

Answered: 1 week ago

Question

Explain the different types of marketing strategies.

Answered: 1 week ago

Question

Explain product positioning.

Answered: 1 week ago

Question

Explain Industrial market segment.

Answered: 1 week ago