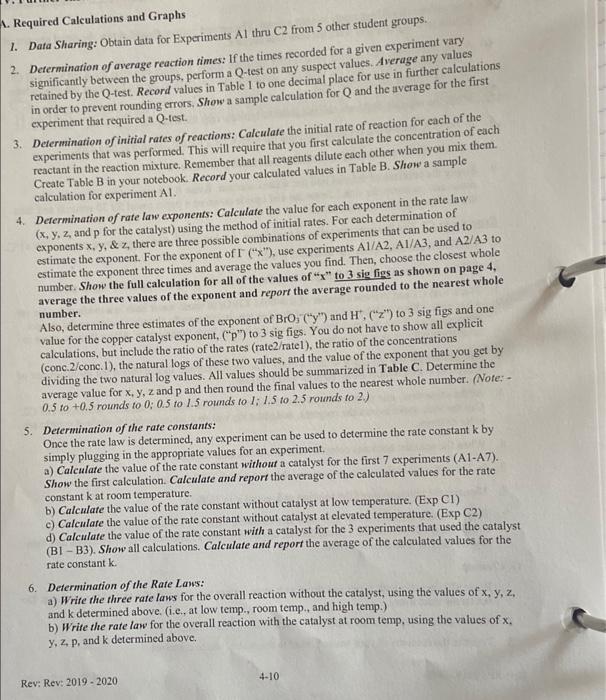
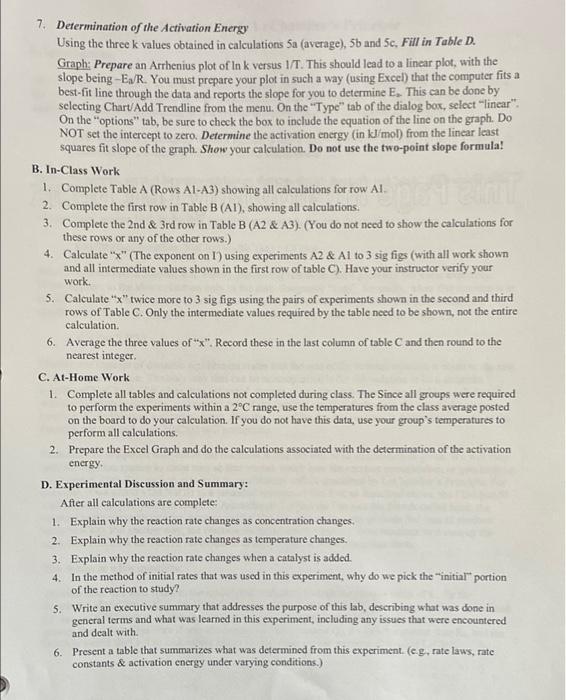
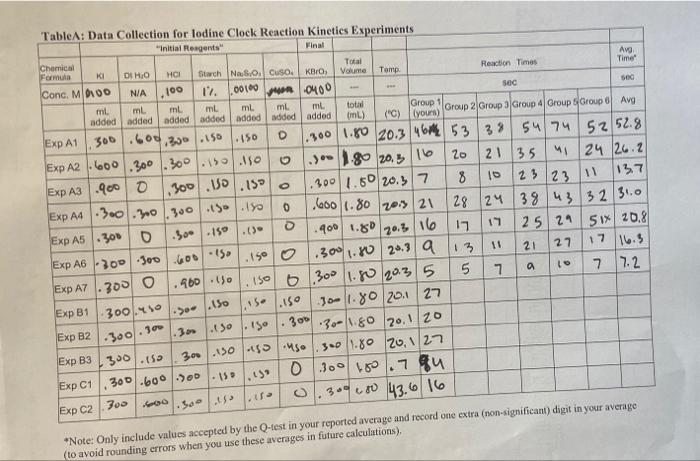
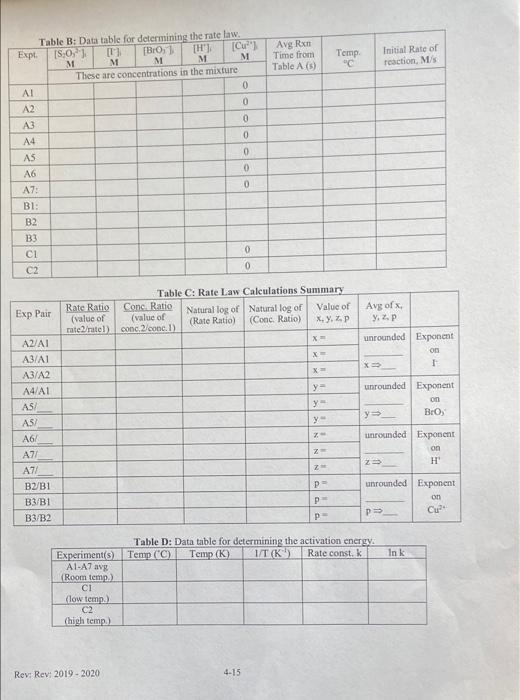
A. Required Calculations and Graphs 1. Data Sharing: Obtain data for Experiments Althru C2 from 5 other student groups. 2. Determination of average reaction times: If the times recorded for a given experiment vary significantly between the groups, perform a Q-test on any suspect values. Average any values retained by the Q-test. Record values in Table 1 to one decimal place for use in further calculations in order to prevent rounding errors, Show a sample calculation for Q and the average for the first experiment that required a Q-test. 3. Determination of initial rates of reactions: Calculate the initial rate of reaction for each of the experiments that was performed. This will require that you first calculate the concentration of each reactant in the reaction mixture. Remember that all reagents dilute cach other when you mix them. Create Table B in your notebook. Record your calculated values in Table B. Show a sample calculation for experiment Al. 4. Determination of rate law exponents: Calculate the value for each exponent in the rate law (x, y, z and p for the catalyst) using the method of initial rates. For each determination of exponents x, y, &z, there are three possible combinations of experiments that can be used to estimate the exponent. For the exponent of I" ("x"), use experiments A1/A2, A1/A3, and A2/A3 to estimate the exponent three times and average the values you find. Then, choose the closest whole number. Show the full calculation for all of the values of "x" to 3 sig figs as shown on page 4, average the three values of the exponent and report the average rounded to the nearest whole number. Also, determine three estimates of the exponent of BrO;"("y") and H. ("z") to 3 sig figs and one value for the copper catalyst exponent. (p") to 3 sig figs. You do not have to show all explicit calculations, but include the ratio of the rates (rate2/ratel), the ratio of the concentrations (conc. 2/conc. 1), the natural logs of these two values, and the value of the exponent that you get by dividing the two natural log values. All values should be summarized in Table C. Determine the average value for x,y,z and p and then round the final values to the nearest whole number. (Note: - 0.5 to +0.5 rounds to 0; 0.5 to 1.5 rounds to 1; 1.5 to 2.5 rounds to 2) 5. Determination of the rate constants: Once the rate law is determined, any experiment can be used to determine the rate constant k by simply plugging in the appropriate values for an experiment. a) Calculate the value of the rate constant without a catalyst for the first 7 experiments (A1-A7). Show the first calculation. Calculate and report the average of the calculated values for the rate constant k at room temperature, b) Calculate the value of the rate constant without catalyst at low temperature. (Exp CI) c) Calculate the value of the rate constant without catalyst at elevated temperature. (Exp C2) d) Calculate the value of the rate constant with a catalyst for the 3 experiments that used the catalyst (BI - B3), Show all calculations. Calculate and report the average of the calculated values for the rate constant k 6. Determination of the Rate Laws: a) Write the three rate laws for the overall reaction without the catalyst, using the values of x, y, 2, and k determined above. (i.c., at low temp., room temp., and high temp.) b) Write the rate law for the overall reaction with the catalyst at room temp, using the values of x. y, zp, and k determined above. 4-10 Rev: Rev: 2019-2020 work. 7. Determination of the Activation Energy Using the three k values obtained in calculations Sa (average), 5b and 5c, Fill in Table D. Graph: Prepare an Arrhenius plot of Ink versus 1/T. This should lead to a linear plot, with the slope being -E/R. You must prepare your plot in such a way (using Excel) that the computer fits a best-fit line through the data and reports the slope for you to determine E. This can be done by selecting Chart Add Trendline from the menu. On the "Type" tab of the dialog box, select "linear". On the "options" tab, be sure to check the box to include the equation of the line on the graph. Do NOT set the intercept to zero. Determine the activation energy (in kJ/mol) from the linear least squares fit slope of the graph. Show your calculation. Do not use the two-point slope formula! B. In-Class Work 1. Complete Table A (Rows A1-A3) showing all calculations for row Al 2. Complete the first row in Table B (A1), showing all calculations. 3. Complete the 2nd & 3rd row in Table B (A2 & A3). (You do not need to show the calculations for these rows or any of the other rows.) 4. Calculate "x" (The exponent on 1) using experiments A2 & A1 to 3 sig figs (with all work shown and all intermediate values shown in the first row of table C). Have your instructor verify your 5. Calculate "x" twice more to 3 sig figs using the pairs of experiments shown in the second and third rows of Table C. Only the intermediate values required by the table need to be shown, not the entire calculation 6. Average the three values of "X". Record these in the last column of table and then round to the nearest integer C. At-Home Work 1. Complete all tables and calculations not completed during class. The Since all groups were required to perform the experiments within a 2C range, use the temperatures from the class average posted on the board to do your calculation. If you do not have this data, use your group's temperatures to perform all calculations 2. Prepare the Excel Graph and do the calculations associated with the determination of the activation energy D. Experimental Discussion and Summary: After all calculations are complete 1. Explain why the reaction rate changes as concentration changes. 2. Explain why the reaction rate changes as temperature changes. 3. Explain why the reaction rate changes when a catalyst is added. 4. In the method of initial rates that was used in this experiment, why do we pick the initial portion of the reaction to study? 5. Write an executive summary that addresses the purpose of this lab, describing what was done in general terms and what was learned in this experiment, including any issues that were encountered and dealt with 6. Present a table that summarizes what was determined from this experiment (eg, rate laws, rate constants & activation energy under varying conditions.) SOC TableA: Data Collection for Iodine Clock Reaction Kineties Experiments "Initial Reagents Final Chemical Formula KI DI HO Total Ava HCI Storch No 8.0, Cuso. KBro, Volume Temp Reaction Times Time Conc. MD100 NIA 100 12. 00100 Jun 0400 so ml. ml ml ml mL ml total added added added added added added added Group 1 (NL) ("C) yours) Group 2 Group 3 Group 4 Group Group 6 Avg ExpA1.300.600,300.150.150 1.300 1.80 20.346 53 38 5474 5252.8 Exp A2 1.600.300.300.150.150 .) - 1.80 20.5 1620 21 35 "24 26.2 Exp A3 -9000 ,300.10.15 300 1.50 20.5 7 8 10 23 137 Exp AA |.300.300.300 150.18 1.600/1.80 20 21 28 124 38 43 32 31.0 Exp A5 .300 0.300 -150.( .400 1.80 17 25 29 51x 20.8 Exp A6 300 300 600 150 .150 0 .300 1.80 20.3 a 13 21 27 17 16.3 EXPAT .300 0 .960.150 150 6300 11.80 20.3 5. 7 Exp B1 10-1.80 201 27 Exp B2 1.300.150 1.150 . 301-30-1.80 20.1.20 Exp B3 300.150 30.150 150 uso 300 1.80 20,127 Exp C1 300-600-500 0 300 18.7 au 159.13 30000 43.6 16 700 Exp C2 GOD OOO 23 11 20,3 16 5 2. .150 15- .150 300.450 .300.30- . . Sets *Note: Only include values accepted by the Q-test in your reported average and record one extra (non-significant) digit in your average (to avoid rounding errors when you use these averages in future calculations), Avg Ron M Time from Table A (5) Temp "C Initial Rate of reaction, MS Table B: Datatable for determining the rate law. Expt [S:0,") IT) [B101 [Cu") M M M M M These are concentrations in the mixture 0 A2 0 A3 0 A4 0 AS 0 A6 0 A7: 0 BI: B2 B3 CI C2 0 0 Exp Pair Table C: Rate Law Calculations Summary Rate Ratio Conc. Ratio Natural log of Natural log of Value of (value of (value of (Rate Ratio) materatel) conc, conc.) (Conc. Ratio) x, y, z, P Avg of Y. ZP unrounded Exponent X on 1 X A2/AI A3/A1 A3/A2 A4/A1 AS unrounded Exponent on y y Bros y AS/ Z A6/ A7/ A7/ Z unrounded Exponent on 2 " Z P unrounded Exponent on B2/B1 B3/B1 B3/B2 P OP P In Table D: Data table for determining the activation energy Experiments) Temp (C) Temp. (K) IT (K Rate const, k Al-A7 avg (Room temp.) CI (low temp. C2 (high temp.) Rev: Rev: 2019-2020 4-15