

Question: A sample of 5 boxes was selected from a process each day for 8 days. The weight of each box (in ounces), along with the
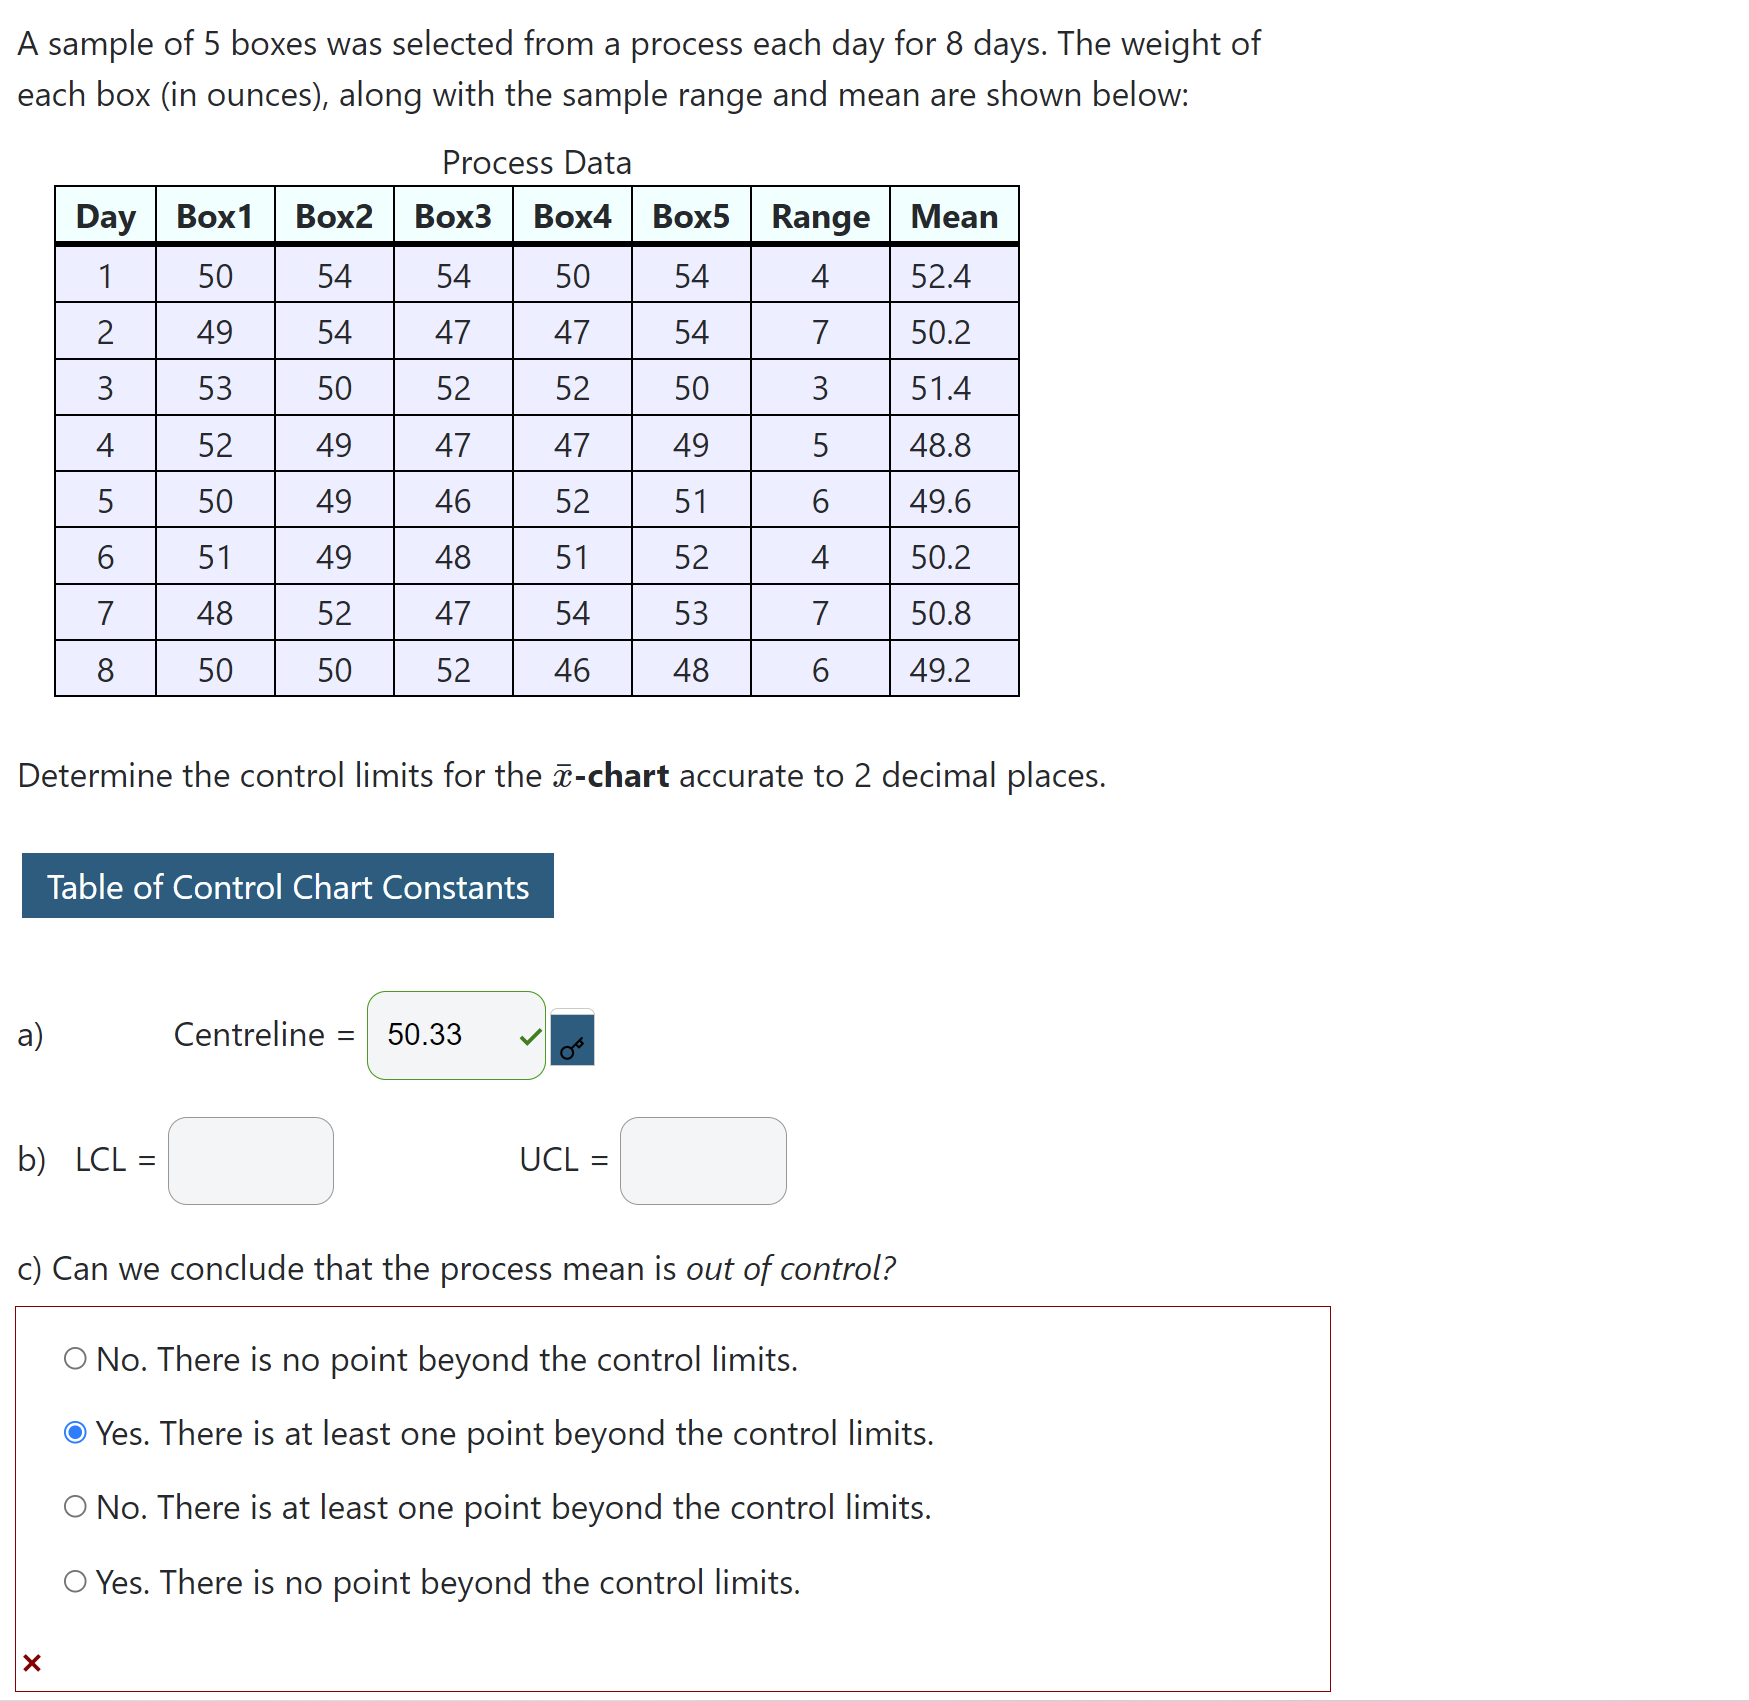
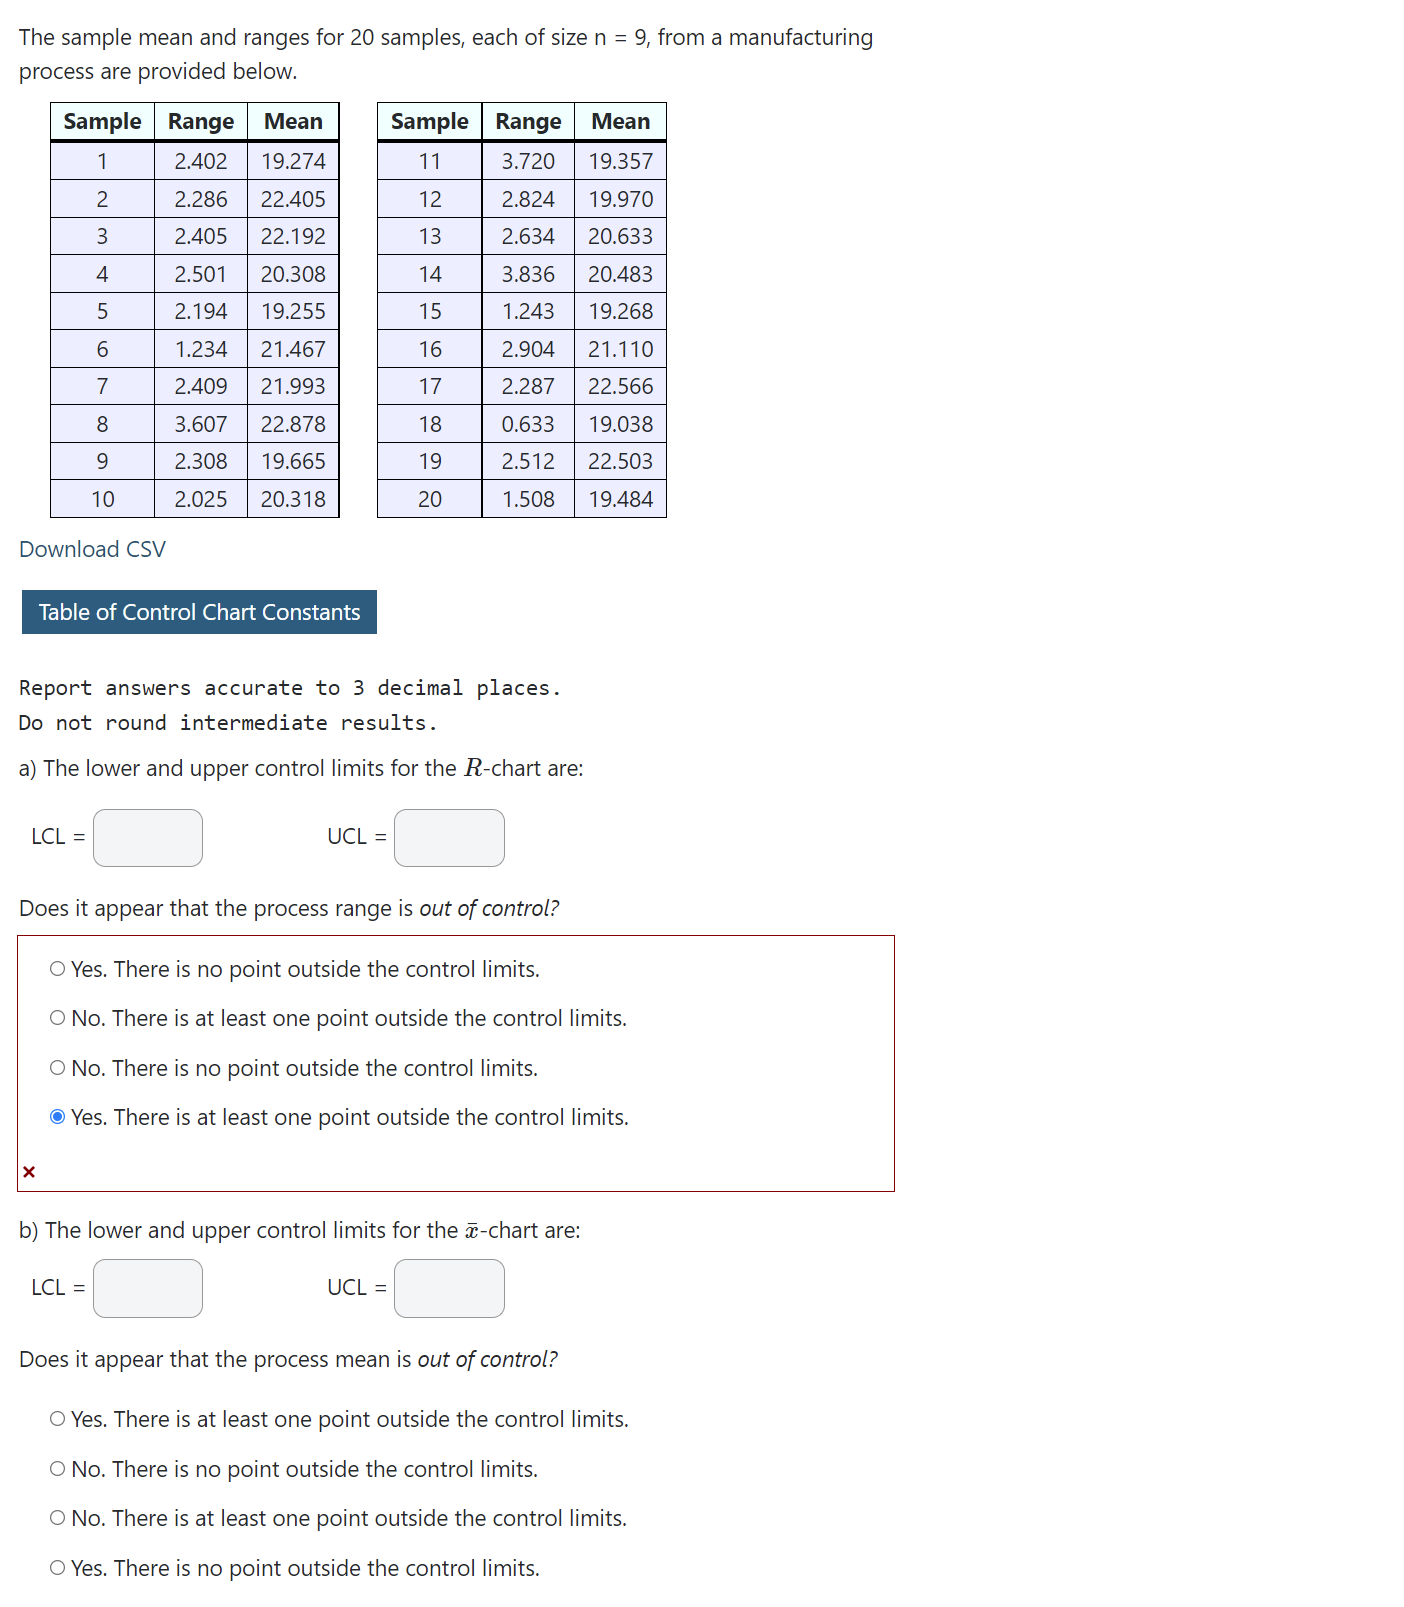
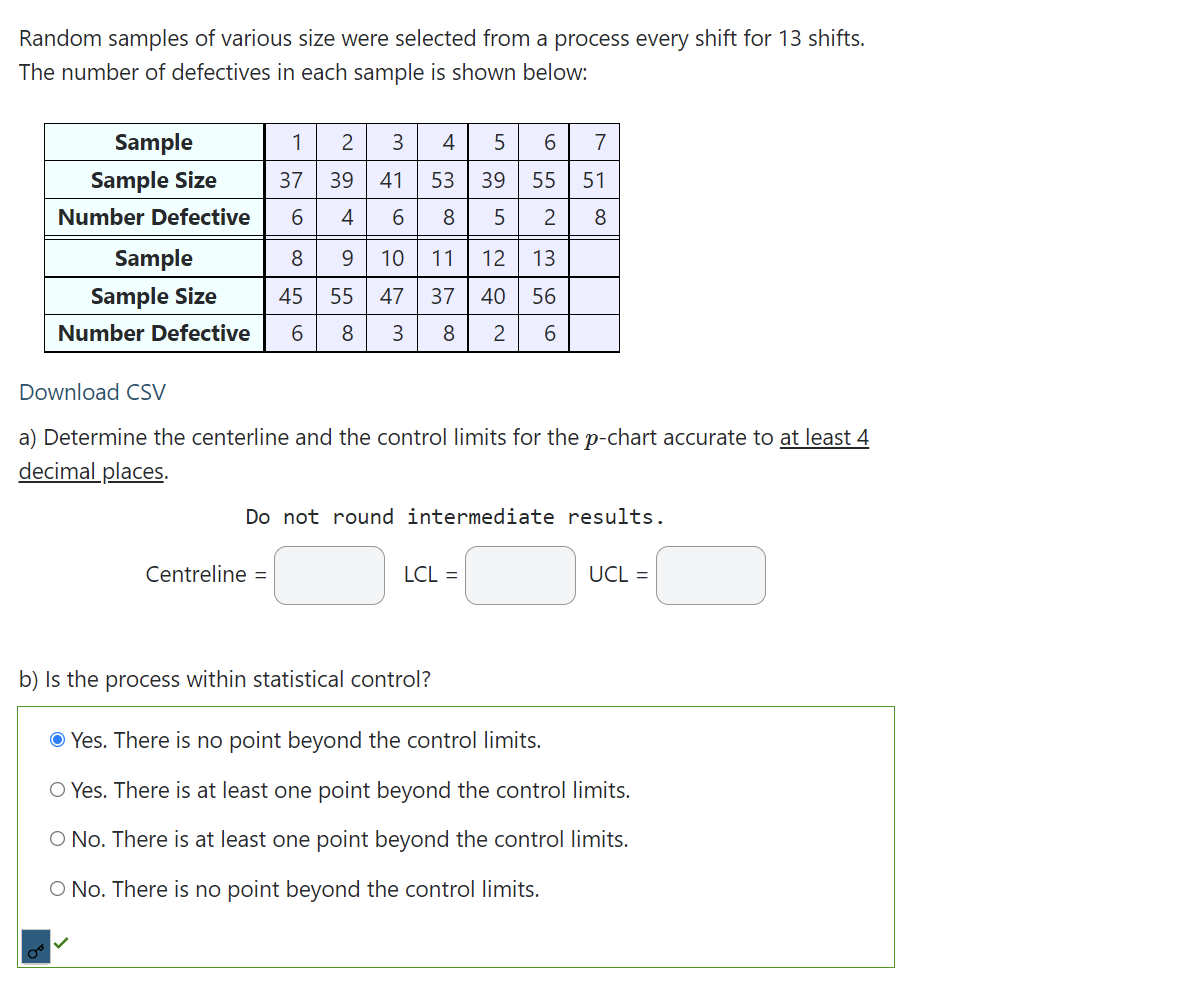
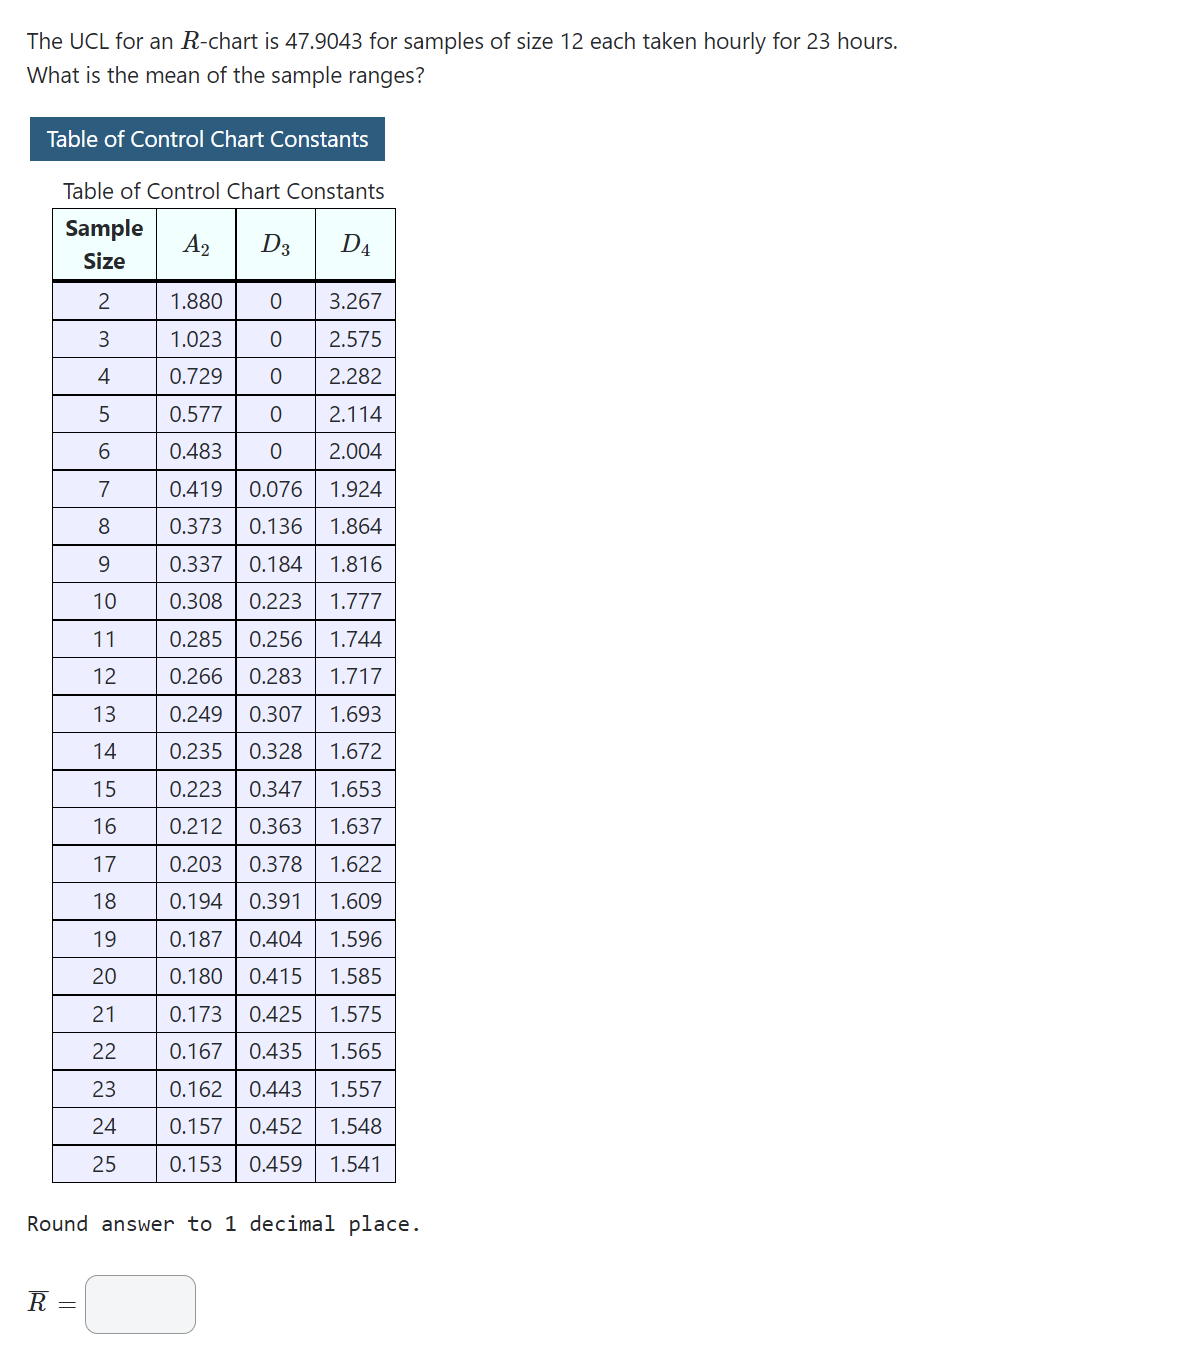
A sample of 5 boxes was selected from a process each day for 8 days. The weight of each box (in ounces), along with the sample range and mean are shown below: Process Data Day Box1 Box2 Box3 Box4 Box5 Range Mean 52.4 50.2 51.4 48.8 49.6 50.2 50.8 49.2 Determine the control limits for the :E-chart accurate to 2 decimal places. Table of Control Chart Constants a) Centreline : 50.33 ~/ I /'\\ / \\. b) LCL=l l UCL=l l \\_ _/ \\_ ./' c) Can we conclude that the process mean is out ofcontrol? O No. There is no point beyond the control limits. Yes. There is at least one point beyond the control limits. 0 No. There is at least one point beyond the control limits. 0 Yes. There is no point beyond the control limits. The sample mean and ranges for 20 samples, each of size n = 9r from a manufacturing process are provided below. Sample Range Mean Sample Range Mean 1 2.402 19.274 11 3.720 19.357 2 2.286 22.405 12 2.824 19.970 3 2.405 22.192 13 2.634 20.633 4 2.501 20.308 14 3.836 20.483 5 2.194 19.255 15 1.243 19.268 6 1.234 21.467 16 2.904 21.110 7 2.409 21.993 17 2.287 22.566 8 3.607 22.878 18 0.633 19.038 9 2.308 19.665 19 2.512 22.503 10 2.025 20.318 20 1.508 19.484 Download CSV Table of Control Chart Constants Report answers accurate to 3 decimal places. Do not round intermediate results. a) The lower and upper control limits for the R-chart are: m@ Cl Does it appear that the process range is out of control? 0 Yes. There is no point outside the control limits. 0 No. There is at least one point outside the control limits. 0 No. There is no point outside the control limits. Yes. There is at least one point outside the control limits. X b) The lower and upper control limits for the :E-chart are: m@ uc= Does it appear that the process mean is our of control? 0 Yes. There is at least one point outside the control limits. 0 No. There is no point outside the control limits. 0 No. There is at least one point outside the control limits. 0 Yes. There is no point outside the control limits. Random samples of various size were selected from a process every shift for 13 shifts. The number of defectives in each sample is shown below: Sample 1 2 3 4 5 6 7 Sample Size 37 39 41 53 39 55 51 Number Defective 6 4 6 8 5 2 8 Sample Sample Size Number Defective Download CSV a} Determine the centerline and the control limits for the p-chart accurate to at least 4 decimal places. Do not round intermediate results. b) Is the process within statistical control? (9 Yes. There is no point beyond the control limits. 0 Yes. There is at least one point beyond the control limits. 0 No. There is at least one point beyond the control limits. 0 No. There is no point beyond the control limits. I' The UCL for an Rchart is 47.9043 for samples of size 12 each taken hourly for 23 hours. What is the mean of the sample ranges? Table of Control Chart Constants Table of Control Chart Constants Sasrir;:|e A2 D3 D4 2 1.880 0 3.267 3 1.023 0 2.575 4 0.729 0 2.282 5 0.577 0 2.114 6 0.483 0 2.004 7 0.419 0.076 1.924 8 0.373 0.136 1.864 9 0.337 0.184 1.816 10 0.308 0.223 1.777 1 1 0.285 0.256 1.744 12 0.266 0.283 1.717 13 0.249 0.307 1.693 14 0.235 0.328 1.672 15 0.223 0.347 1.653 16 0.212 0.363 1.637 17 0.203 0.378 1.622 18 0.194 0.391 1.609 19 0.187 0.404 1.596 20 0.180 0.415 1.585 21 0.173 0.425 1.575 22 0.167 0.435 1.565 23 0.162 0.443 1.557 24 0.157 0.452 1.548 25 0.153 0.459 1.541 Round answer to 1 decimal place. mCJ
Step by Step Solution
There are 3 Steps involved in it

Get step-by-step solutions from verified subject matter experts