A sheries biologist studying Whitesh in a Canadian Lake collected data on the length (in centimeters) and egg production for 25 female sh. A scatter
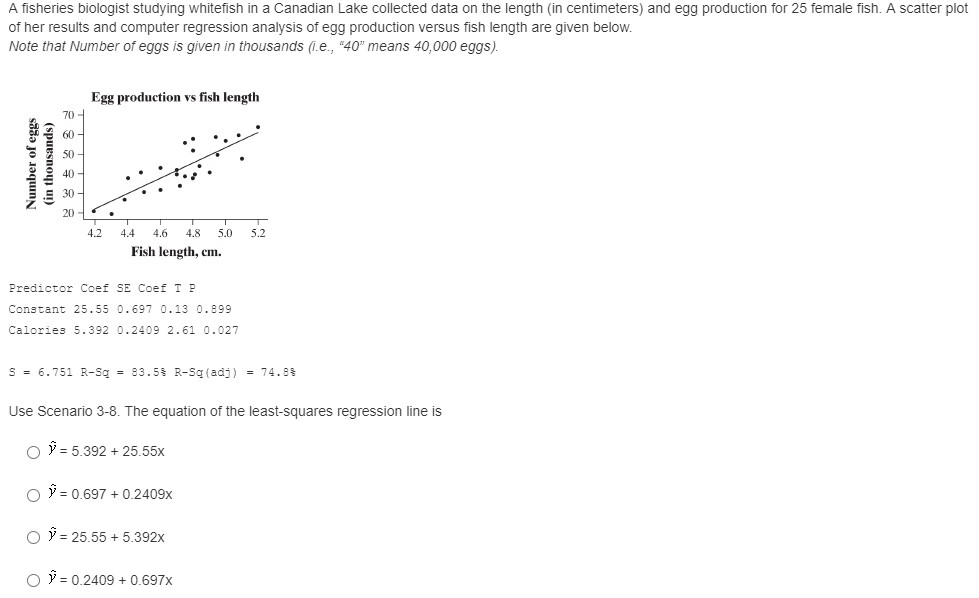
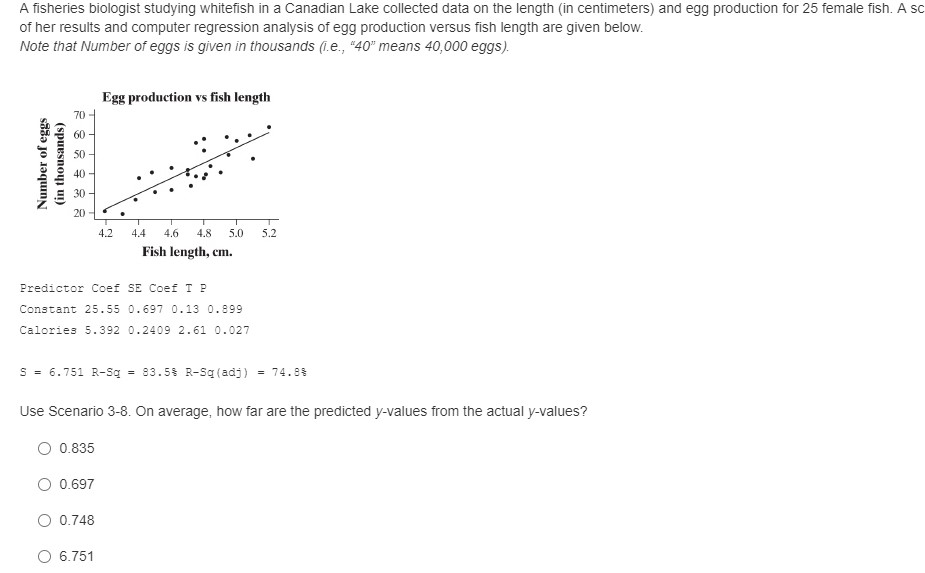
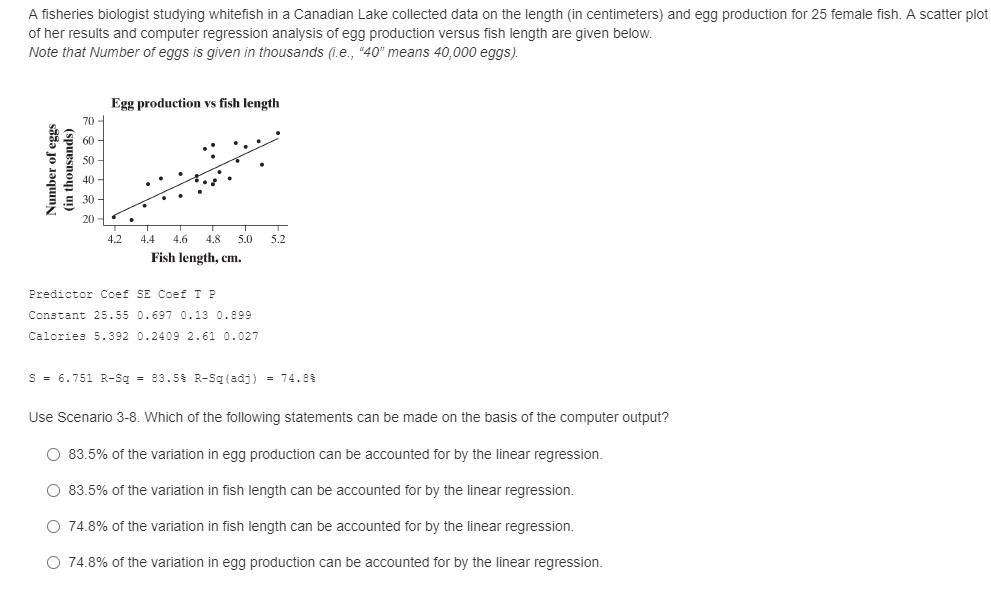
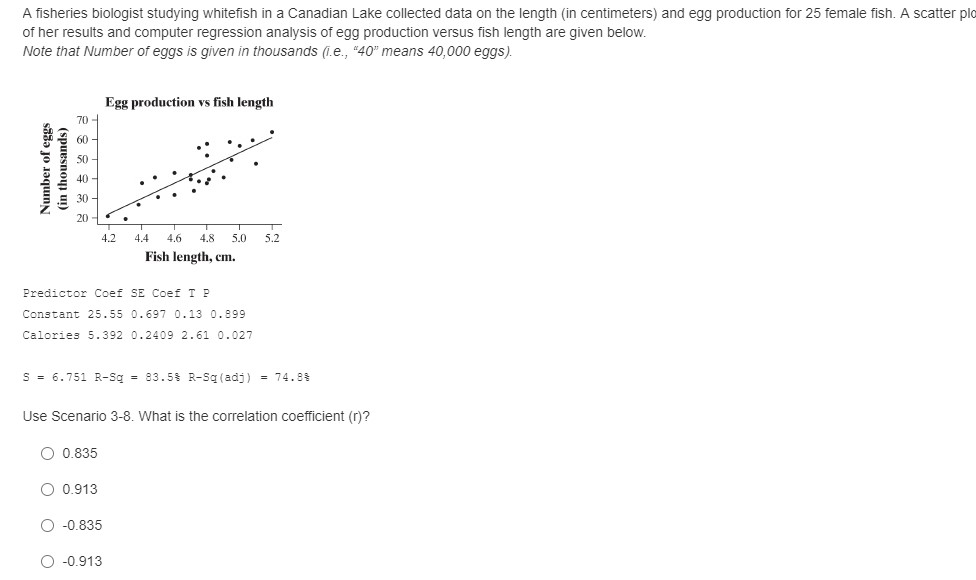
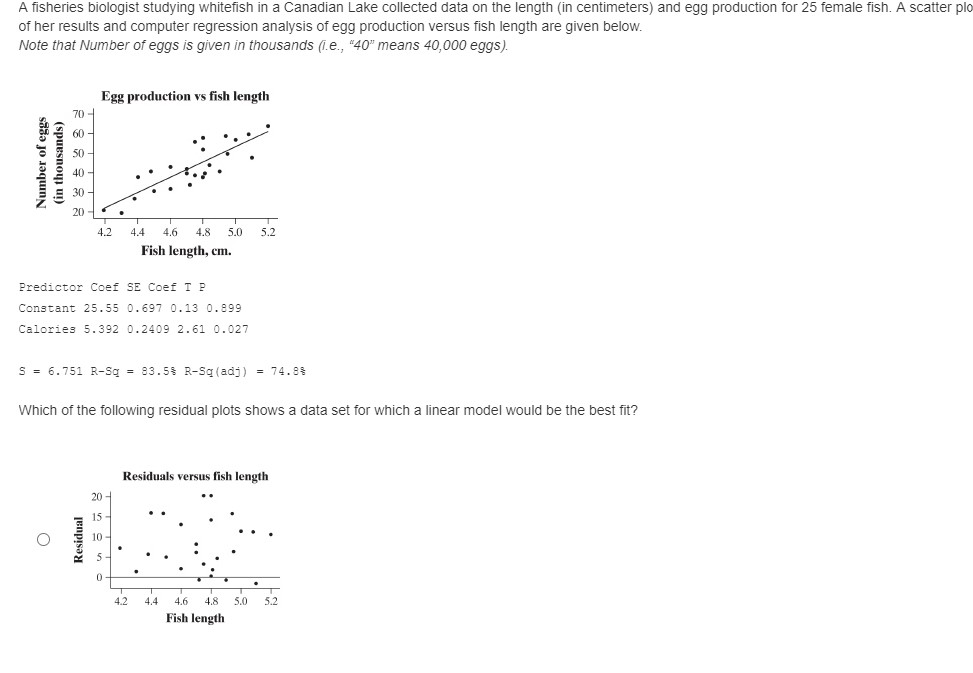
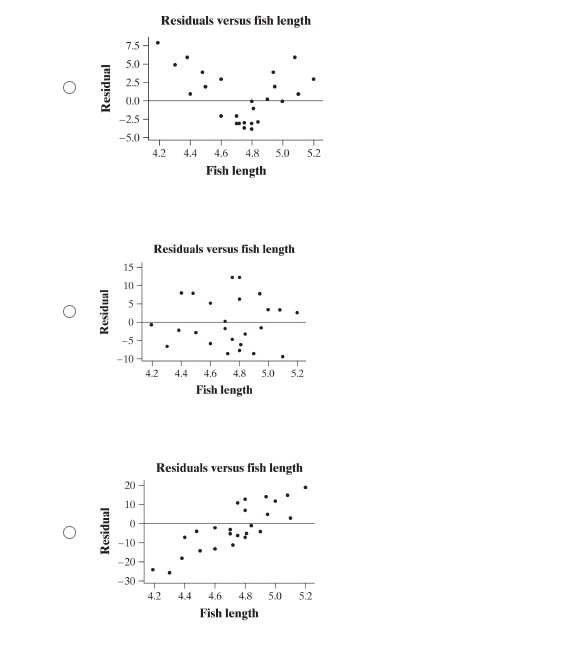
A sheries biologist studying Whitesh in a Canadian Lake collected data on the length (in centimeters) and egg production for 25 female sh. A scatter plot of her results and computer regression analysis of egg production versus sh length are given below. Note that Number of eggs is given in thousands e, \"40\" means 40,000 eggs). Egg production vs sh length (inthousands) El 8 E S 3% 3 Number of eggs 4.2. 4.4 4.6 4.8 5.0 5.2 Flshlmgth Predictor Coef 5E Coef T P Constant 25.55 [3.697 0.13 0.599 Calories 5.392 [3.2409 2.61 0.027 s = 5.?51 RSq = 33.5% RSqlfadj} = nee Use Scenario 38. The equation of the least-squares regression line is O Y = 5.392 + 25.55): 0 J' = 0.59? + 0.2409): 0 Y = 25.55 + 5.392): O Y = 0.2409 + 0.697): A fisheries biologist studying whitefish in a Canadian Lake collected data on the length (in centimeters) and egg production for 25 female fish. A so of her results and computer regression analysis of egg production versus fish length are given below. Note that Number of eggs is given in thousands (1.e., "40" means 40,000 eggs). Egg production vs fish length 70 60 - 50 - Number of eggs (in thousands) 40 - 4.2 4.4 4.6 4.8 5.0 5.2 Fish length, cm. Predictor Coef SE Coef T P Constant 25.55 0. 697 0.13 0.899 Calories 5. 392 0. 2409 2.61 0.027 S = 6.751 R-Sq = 83.54 R-Sq(adj) = 74.8: Use Scenario 3-8. On average, how far are the predicted y-values from the actual y-values? O 0.835 O 0.697 O 0.748 O 6.751A fisheries biologist studying whitefish in a Canadian Lake collected data on the length (in centimeters) and egg production for 25 female fish. A scatter plot of her results and computer regression analysis of egg production versus fish length are given below. Note that Number of eggs is given in thousands (i.e., "40" means 40,000 eggs). Egg production vs fish length (in thousands) Number of eggs 4.2 4.4 4.6 4.8 5.0 5.2 Fish length, cm. Predictor Coef SE Coef T P Constant 25.55 0. 697 0.13 0.899 Calories 5. 392 0. 2409 2. 61 0.027 5 = 6. 751 R-Sq = 83. 54 R-Sq(adj ) = 74.8: Use Scenario 3-8. Which of the following statements can be made on the basis of the computer output? O 83.5% of the variation in egg production can be accounted for by the linear regression. O 83.5% of the variation in fish length can be accounted for by the linear regression. 74.8% of the variation in fish length can be accounted for by the linear regression. O 74.8% of the variation in egg production can be accounted for by the linear regression.A fisheries biologist studying whitefish in a Canadian Lake collected data on the length (in centimeters) and egg production for 25 female fish. A scatter plo of her results and computer regression analysis of egg production versus fish length are given below. Note that Number of eggs is given in thousands (i.e., "40" means 40,000 eggs). Egg production vs fish length 70 - 60 50 Number of eggs (in thousands) 20- 4.2 4.4 4.6 4.8 5.0 5.2 Fish length, cm. Predictor Coef SE Coef T P Constant 25.55 0.697 0.13 0. 899 Calories 5.392 0. 2409 2. 61 0.027 S = 6.751 R-Sq = 83. 54 R-Sq(adj ) = 74.8: Use Scenario 3-8. What is the correlation coefficient (r)? O 0.835 O 0.913 O -0.835 O -0.913A fisheries biologist studying whitefish in a Canadian Lake collected data on the length (in centimeters) and egg production for 25 female fish. A scatter plo of her results and computer regression analysis of egg production versus fish length are given below. Note that Number of eggs is given in thousands (i.e., "40" means 40,000 eggs). Egg production vs fish length 70 - 60 - 50 - Number of eggs (in thousands) 40 4.2 4.4 4.6 4.8 5.0 5.2 Fish length, cm. Predictor Coef SE Coef T P Constant 25.55 0. 697 0.13 0.899 Calories 5. 392 0.2409 2. 61 0.027 S = 6. 751 R-Sq = 83.54 R-Sq(adj) = 74.8: Which of the following residual plots shows a data set for which a linear model would be the best fit? Residuals versus fish length 20 15 O Residual 10 4.2 4.4 5.0 5.2 Fish lengthResiduals versus fish length 7.5 - 5.0 - O 2.5 Residual 0.0- -2.5 - -5.0 - 4.2 4.4 4.6 4.8 5.0 5.2 Fish length Residuals versus fish length 15 - 10 O Residual -10 42 4.4 4.6 4.8 5.0 5.2 Fish length Residuals versus fish length 20 - 10 - 0 O Residual -10 - -20 - -30 - 4.2 4.4 4.6 4.8 5.0 5.2 Fish length
Step by Step Solution
There are 3 Steps involved in it
Step: 1
Get Instant Access to Expert-Tailored Solutions
See step-by-step solutions with expert insights and AI powered tools for academic success
Step: 2
Step: 3
Ace Your Homework with AI
Get the answers you need in no time with our AI-driven, step-by-step assistance