

Question
A small municipality is divided into four sectors where household waste is collected five days a week, Monday to Friday. These frequent collections are expensive
A small municipality is divided into four sectors where household waste is collected five days a week, Monday to Friday. These frequent collections are expensive for the city, but the pressure from environmentalists is strong and the inhabitants are proud to declare that they live in the city the most. Once collected, the waste is sent to two transshipment centers where it is transferred to heavier trucks, to finally be transported to three landfill sites. The following table summarizes the data relevant to the transport of waste
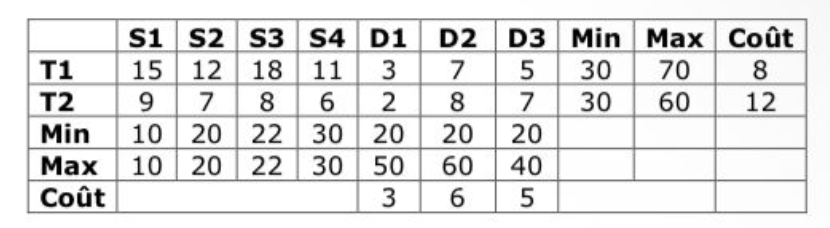
Here's how to interpret the entries in this table. - The first seven columns, S1 to D3, are associated with city sectors and landfill sites; lines T1 and T2, at transhipment centres. - Consider the line Ti(i=1,2). We find in column Sj (j=1, 2, 3, 4) the transport cost (in euros per tonne) of waste from sector Sj to center Ti, and in column Dj (j=1, 2, 3 ) the transport cost (in euros per tonne) from Ti to Dj. - The Min and Max lines indicate the minimum and maximum quantities (in tonnes per day) of waste that can be picked up in the different sectors, or that can be received by landfills, while the Cost line gives the cost of treatment (in euros per tonne) of waste from each of the sites. - Similarly, the values of the Min and Max columns correspond to the minimum and maximum capacities (in tonnes per day) of centers T1 and T2; those in the last column, at the transshipment cost (in euros per ton) of the waste at the T1 and T2 centres. We note that the minima and maxima of columns S1 to S4 coincide: that is to say that the municipal officials have noted that, in each of the sectors, the actual quantity of waste collected varies little from one day to another. and they decided, for the purposes of the analysis, to take as minimum and maximum of a sector the average observed in the last year in it. City officials asked officials to develop an optimal waste transport policy. Determine, with the help of an appropriate network, a waste transport plan at the lowest cost.
\begin{tabular}{|l|c|c|c|c|c|c|c|c|c|c|} \hline & S1 & S2 & S3 & S4 & D1 & D2 & D3 & Min & Max & Cot \\ \hline T1 & 15 & 12 & 18 & 11 & 3 & 7 & 5 & 30 & 70 & 8 \\ \hline T2 & 9 & 7 & 8 & 6 & 2 & 8 & 7 & 30 & 60 & 12 \\ \hline Min & 10 & 20 & 22 & 30 & 20 & 20 & 20 & & & \\ \hline Max & 10 & 20 & 22 & 30 & 50 & 60 & 40 & & & \\ \hline Cot & & & & & 3 & 6 & 5 & & & \\ \hline \end{tabular} \begin{tabular}{|l|c|c|c|c|c|c|c|c|c|c|} \hline & S1 & S2 & S3 & S4 & D1 & D2 & D3 & Min & Max & Cot \\ \hline T1 & 15 & 12 & 18 & 11 & 3 & 7 & 5 & 30 & 70 & 8 \\ \hline T2 & 9 & 7 & 8 & 6 & 2 & 8 & 7 & 30 & 60 & 12 \\ \hline Min & 10 & 20 & 22 & 30 & 20 & 20 & 20 & & & \\ \hline Max & 10 & 20 & 22 & 30 & 50 & 60 & 40 & & & \\ \hline Cot & & & & & 3 & 6 & 5 & & & \\ \hline \end{tabular}Step by Step Solution
There are 3 Steps involved in it
Step: 1

Get Instant Access to Expert-Tailored Solutions
See step-by-step solutions with expert insights and AI powered tools for academic success
Step: 2

Step: 3
Ace Your Homework with AI
Get the answers you need in no time with our AI-driven, step-by-step assistance
Get Started
Bill Payment Tracker A Financial Organizer For Efficient Expense Management
Authors: Tommy Ruell
1st Edition
B0CGWPF86P