

Question
A steel pipe company recently developed a new pipe product for a customer. According to?specifications, the pipe is supposed to have an average outside diameter
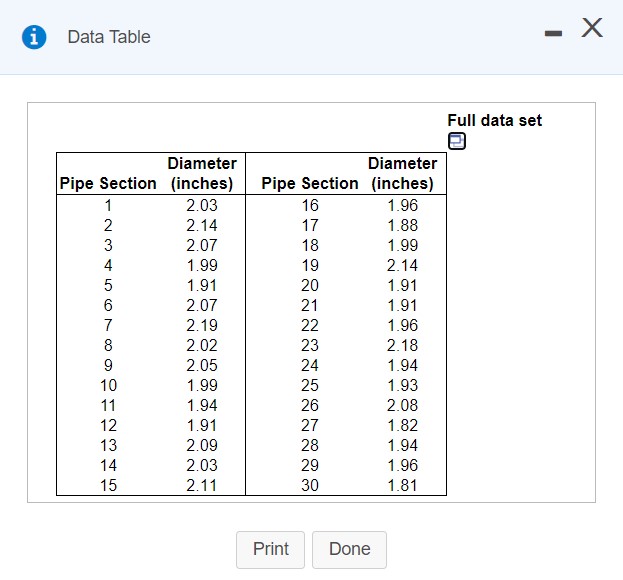
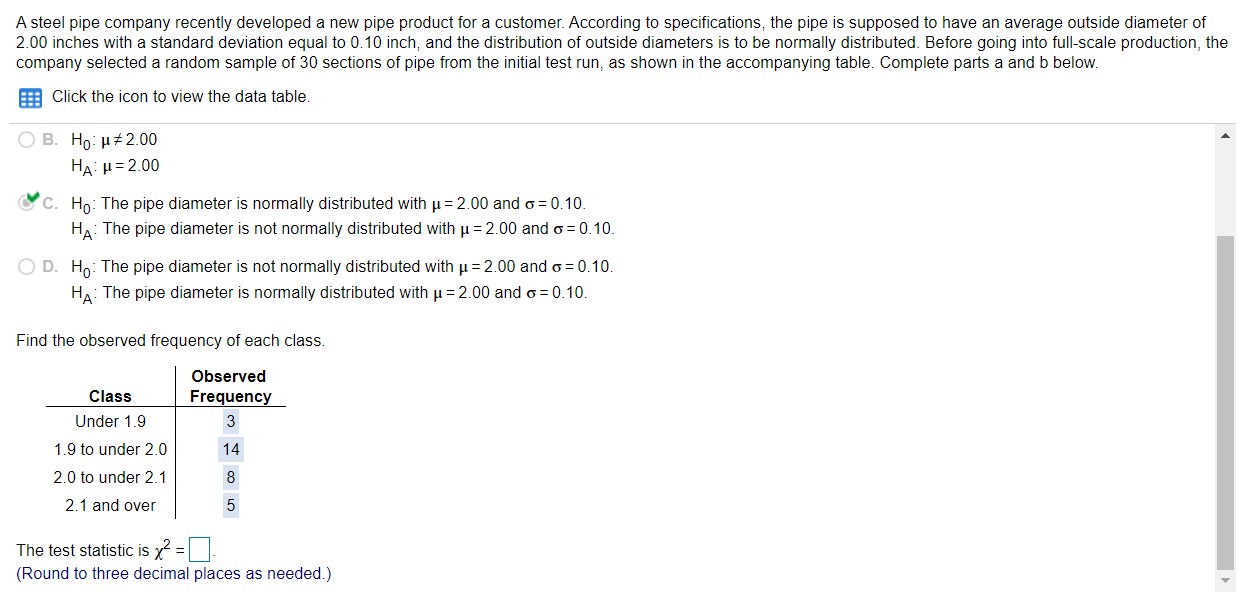
A steel pipe company recently developed a new pipe product for a customer. According to?specifications, the pipe is supposed to have an average outside diameter of 2.00 inches with a standard deviation equal to 0.10?inch, and the distribution of outside diameters is to be normally distributed. Before going into?full-scale production, the company selected a random sample of 30 sections of pipe from the initial test?run, as shown in the accompanying table. Complete parts a and b below.
Step by Step Solution
There are 3 Steps involved in it
Step: 1

Get Instant Access to Expert-Tailored Solutions
See step-by-step solutions with expert insights and AI powered tools for academic success
Step: 2

Step: 3
Ace Your Homework with AI
Get the answers you need in no time with our AI-driven, step-by-step assistance
Get Started
Beginning Algebra A Text/Workbook
Authors: Charles P McKeague
2nd Edition
1483271242, 9781483271248