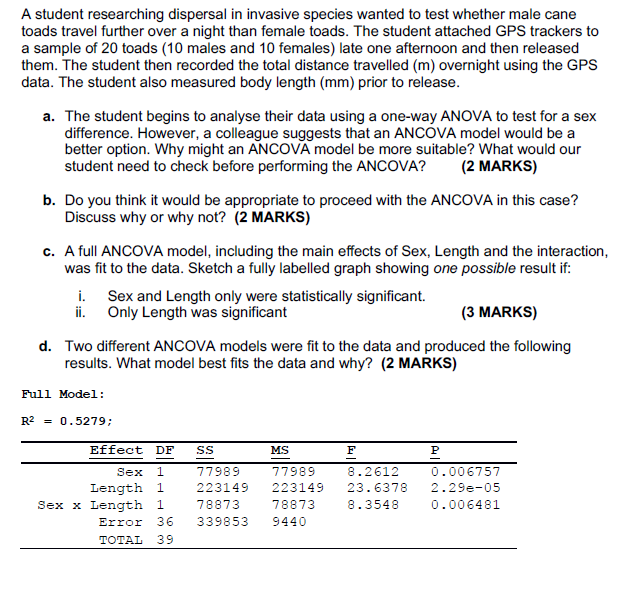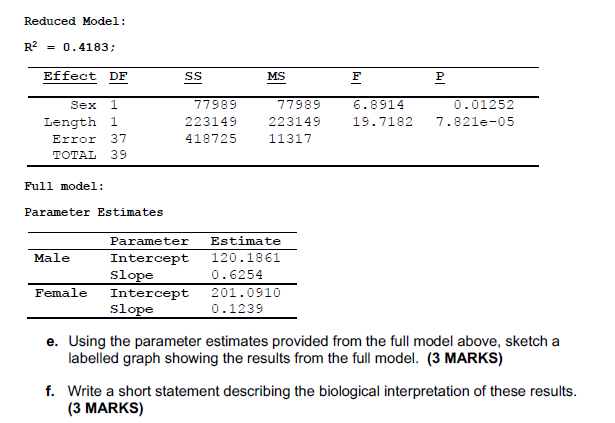

A student researching dispersal in invasive species wanted to test whether male cane toads travel further over a night than female toads. The student attached GPS trackers to a sample of 20 toads (10 males and 10 females) late one afternoon and then released them. The student then recorded the total distance travelled (m) overnight using the GPS data. The student also measured body length (mm) prior to release. a. The student begins to analyse their data using a one-way ANOVA to test for a sex difference. However, a colleague suggests that an ANCOVA model would be a better option. Why might an ANCOVA model be more suitable? What would our student need to check before performing the ANCOVA? (2 MARKS) b. Do you think it would be appropriate to proceed with the ANCOVA in this case? Discuss why or why not? (2 MARKS) c. A full ANCOVA model, including the main effects of Sex, Length and the interaction, was fit to the data. Sketch a fully labelled graph showing one possible result if: i. Sex and Length only were statistically significant ii. Only Length was significant (3 MARKS) d. Two different ANCOVA models were fit to the data and produced the following results. What model best fits the data and why? (2 MARKS) Full Model: R2 = 0.5279; Effect DF SS MS F P Sex 1 Length 1 Sex x Length 1 Error 36 TOTAL 39 77989 223149 78873 339853 77989 223149 78873 9440 8.2612 23.6378 8.3548 0.006757 2.29e-05 0.006481 Reduced Model: R2 = 0.4183; Effect DF SS MS F A4 77989 223149 418725 Sex Length 1 Error 37 TOTAL 39 77989 223149 11317 6.8914 19.7182 0.01252 7.821e-05 Full model: Parameter Estimates Male Parameter Intercept slope Intercept slope Estimate 120.1861 0.6254 201.0910 0.1239 Female e. Using the parameter estimates provided from the full model above, sketch a labelled graph showing the results from the full model. (3 MARKS) f. Write a short statement describing the biological interpretation of these results. (3 MARKS) A student researching dispersal in invasive species wanted to test whether male cane toads travel further over a night than female toads. The student attached GPS trackers to a sample of 20 toads (10 males and 10 females) late one afternoon and then released them. The student then recorded the total distance travelled (m) overnight using the GPS data. The student also measured body length (mm) prior to release. a. The student begins to analyse their data using a one-way ANOVA to test for a sex difference. However, a colleague suggests that an ANCOVA model would be a better option. Why might an ANCOVA model be more suitable? What would our student need to check before performing the ANCOVA? (2 MARKS) b. Do you think it would be appropriate to proceed with the ANCOVA in this case? Discuss why or why not? (2 MARKS) c. A full ANCOVA model, including the main effects of Sex, Length and the interaction, was fit to the data. Sketch a fully labelled graph showing one possible result if: i. Sex and Length only were statistically significant ii. Only Length was significant (3 MARKS) d. Two different ANCOVA models were fit to the data and produced the following results. What model best fits the data and why? (2 MARKS) Full Model: R2 = 0.5279; Effect DF SS MS F P Sex 1 Length 1 Sex x Length 1 Error 36 TOTAL 39 77989 223149 78873 339853 77989 223149 78873 9440 8.2612 23.6378 8.3548 0.006757 2.29e-05 0.006481 Reduced Model: R2 = 0.4183; Effect DF SS MS F A4 77989 223149 418725 Sex Length 1 Error 37 TOTAL 39 77989 223149 11317 6.8914 19.7182 0.01252 7.821e-05 Full model: Parameter Estimates Male Parameter Intercept slope Intercept slope Estimate 120.1861 0.6254 201.0910 0.1239 Female e. Using the parameter estimates provided from the full model above, sketch a labelled graph showing the results from the full model. (3 MARKS) f. Write a short statement describing the biological interpretation of these results


