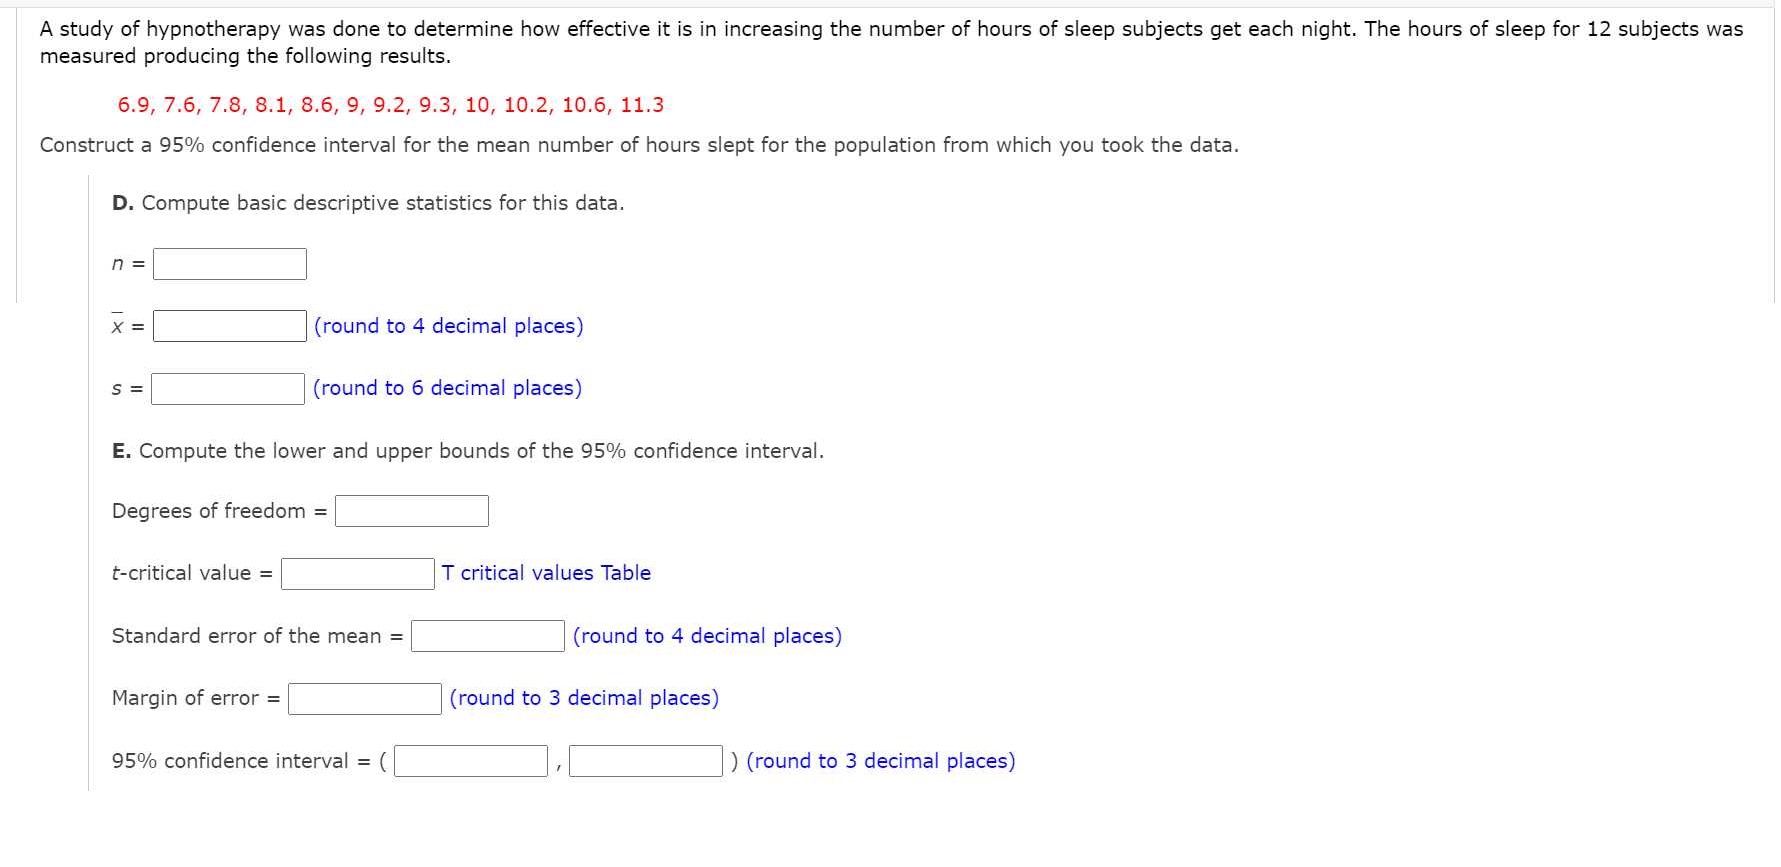
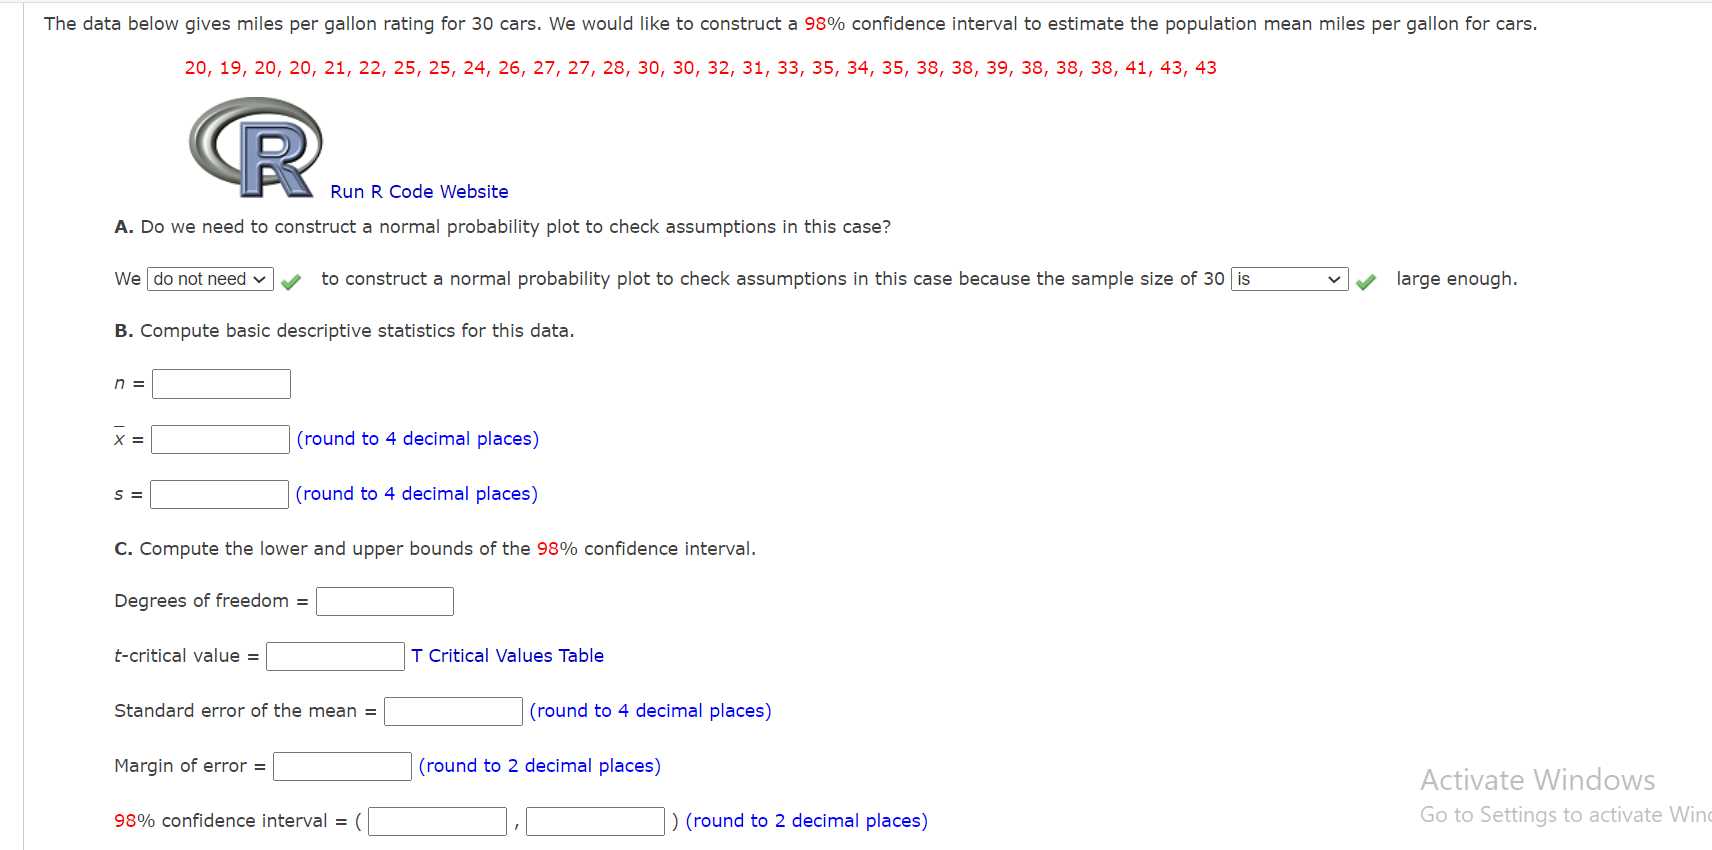
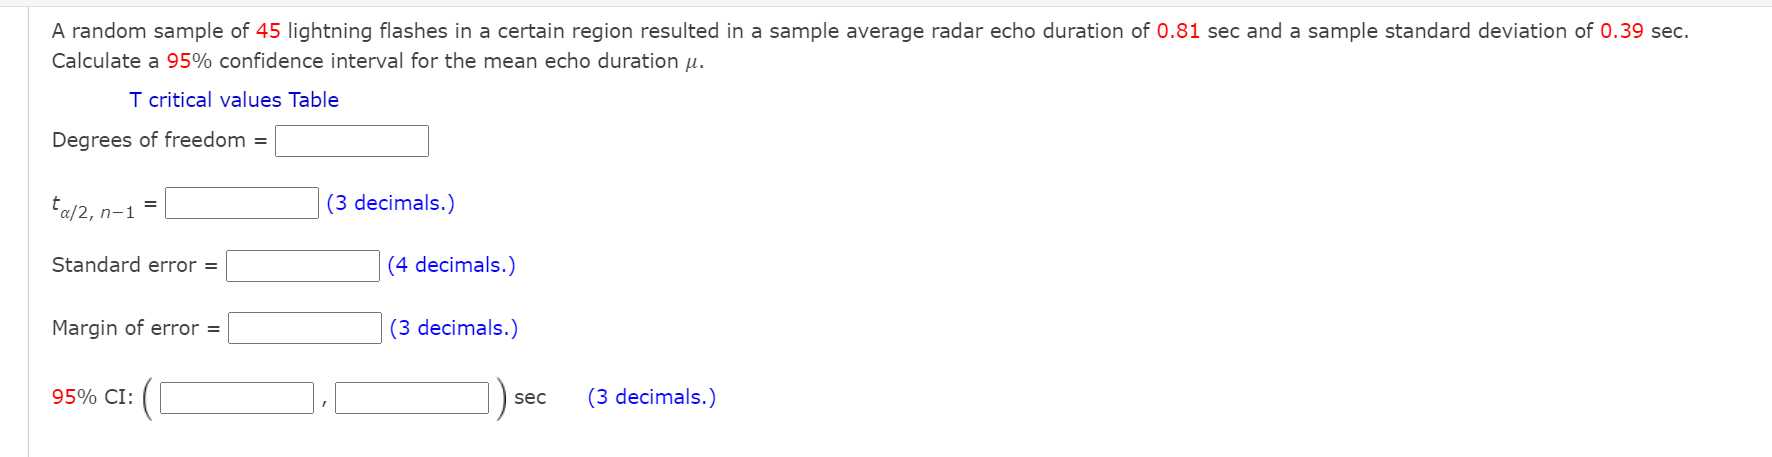
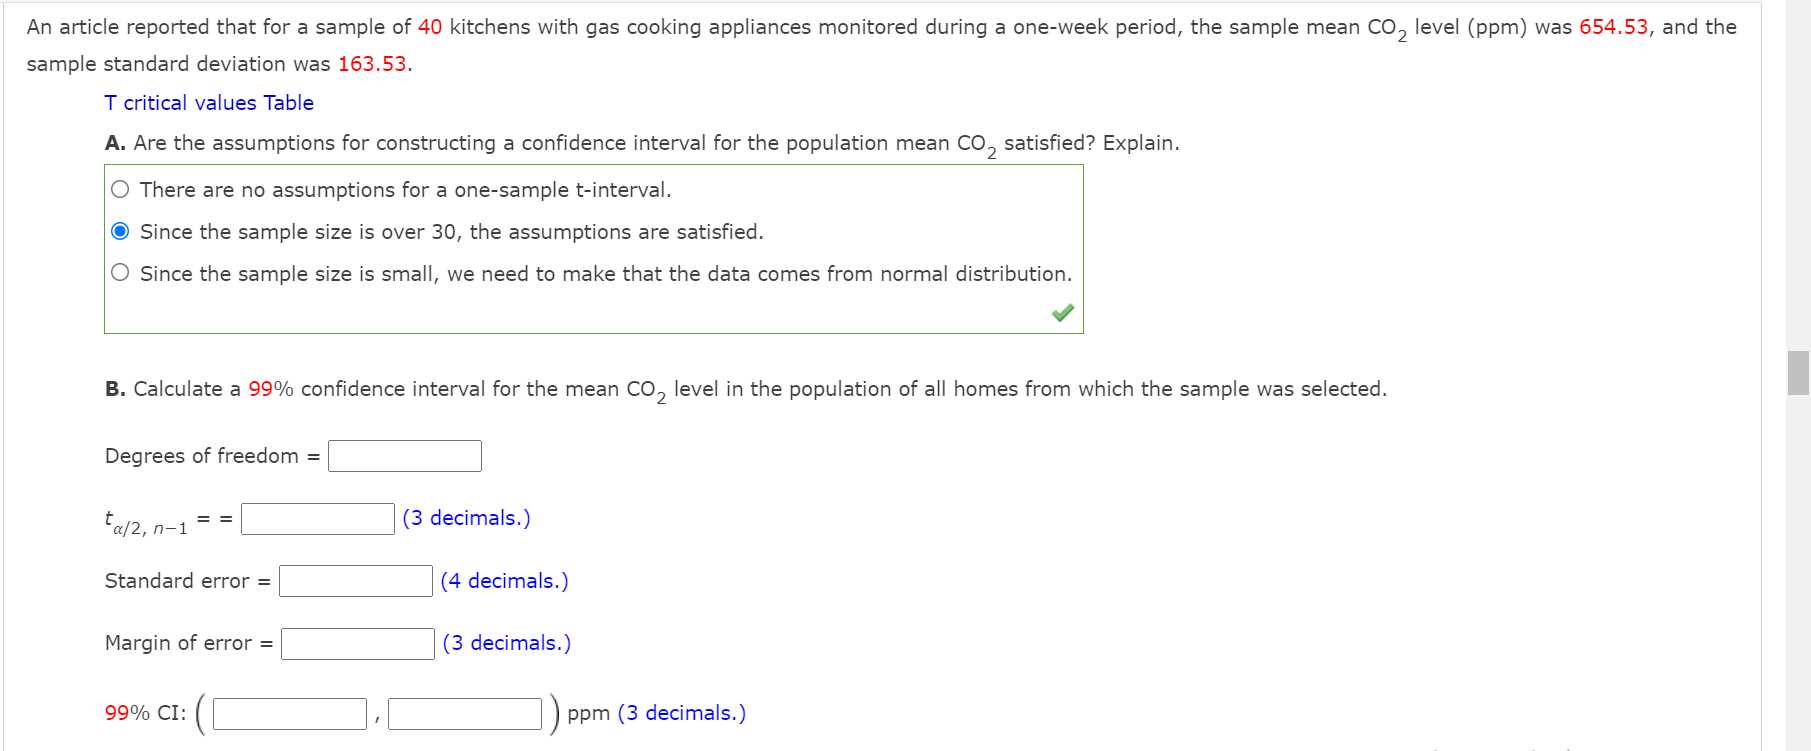
A study of hypnotherapy was done to determine how effective it is in increasing the number of hours of sleep subjects get each night. The hours of sleep for 12 subjecir. was measured producing the following results. 6.9, 7.6, 7.8, 8.1, 8.6, 9, 9.2, 9.3, 10, 10.2, 10.6, 11.3 Construct a 95% condence interval for the mean number of hours slept for the population from which you took the data. D. Compute basic descriptive statistics for this data. E. Compute the lower and upper bounds of the 95% condence interval. Degrees of freedom = S tcritical value = S T critical values Table Standard error of the mean = (round to 4 decimal places) Margin of error = S (round to 3 decimal places) 95% condence interval = ( S , :l ) (round to 3 decimal places) The data below gives miles per gallon rating for 30 cars. We would like to construct a 98% confidence interval to estimate the population mean miles per gallon for cars. 20, 19, 20, 20, 21, 22, 25, 25, 24, 26, 27, 27, 28, 30, 30, 32, 31, 33, 35, 34, 35, 38, 38, 39, 38, 38, 38, 41, 43, 43 R Run R Code Website A. Do we need to construct a normal probability plot to check assumptions in this case? We do not need v to construct a normal probability plot to check assumptions in this case because the sample size of 30 is large enough. B. Compute basic descriptive statistics for this data. n = X = ( round to 4 decimal places) S = (round to 4 decimal places) C. Compute the lower and upper bounds of the 98% confidence interval. Degrees of freedom = t-critical value = T Critical Values Table Standard error of the mean = (round to 4 decimal places) Margin of error = (round to 2 decimal places) Activate Windows 98% confidence interval = ( ) (round to 2 decimal places) Go to Settings to activate WinA random sample of 45 lightning ashes in a certain region resulted in a sample average radar echo duration of 0.81 sec and a sample standard deviation of 0.39 sec. Calculate a 95% condence interval for the mean echo duration u. T critical values Table Degrees of freedom = 91/2, n_} = (3 decimals.) Standard error = E (4 decimals.) Margin of error = \\:| (3 decimals.) 95% CI: (S , E ) sec (3 decimals.) Ari article reported that for a sample of 40 kitchens with gas cooking appliances monitored during a one-week period, the sample mean CO2 level (ppm) was 654.53, and the sample standard deviation was 163.53. T critical values Table A. Are the assumptions for constructing a condence interval for the population mean (:02 satised? Explain. Q There are no assumptions for a onesample tinterval. G) Since the sample size is over 30, the assumptions are satised. 0 Since the sample size is small, we need to make that the data comes from normal distribution. J B. Calculate a 99% condence interval for the mean CO2 ]evel in the population of all homes from which the sample was selected. Degrees of freedom = \\:| Standard error = I: (4 decimals.) Margin of error = \\:| (3 decimals.) 99% CI: (: , E ) ppm (3 decimals.)