Answered step by step
Verified Expert Solution
Question
1 Approved Answer
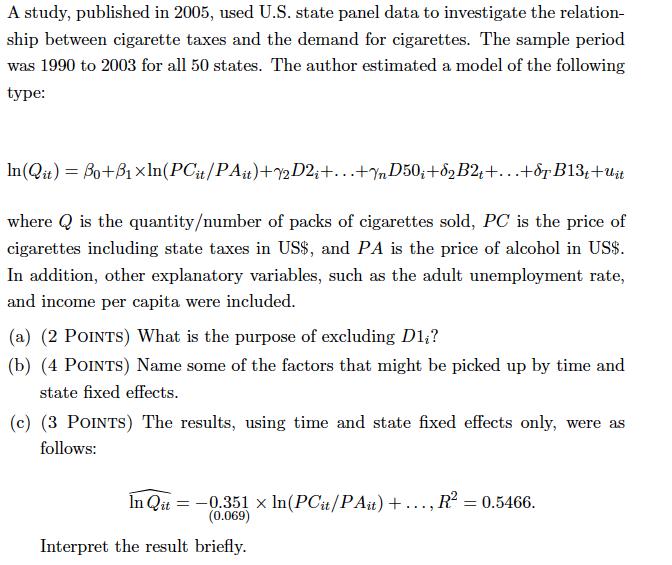
A study, published in 2005, used U.S. state panel data to investigate the relation- ship between cigarette taxes and the demand for cigarettes. The


A study, published in 2005, used U.S. state panel data to investigate the relation- ship between cigarette taxes and the demand for cigarettes. The sample period was 1990 to 2003 for all 50 states. The author estimated a model of the following type: In(Qit)= Bo+B xln(PCit/PAit)+Y2D2i+...+YnD50i+62B2t+...+6TB13t+Uit where is the quantity/number of packs of cigarettes sold, PC is the price of cigarettes including state taxes in US$, and PA is the price of alcohol in US$. In addition, other explanatory variables, such as the adult unemployment rate, and income per capita were included. (a) (2 POINTS) What is the purpose of excluding D1;? (b) (4 POINTS) Name some of the factors that might be picked up by time and state fixed effects. (c) (3 POINTS) The results, using time and state fixed effects only, were as follows: In Qit = -0.351 x ln(PCit/PAit) + (0.069) Interpret the result briefly. ... R = 0.5466. (d) (3 POINTS) To test for the relevance of the state fixed effects, you restrict the regression by dropping all state fixed effects. The relevant F-statistic is 129.3. What are the degrees of freedom? What is the critical value from your F table and what can you conclude?
Step by Step Solution
★★★★★
3.46 Rating (162 Votes )
There are 3 Steps involved in it
Step: 1
The user is asking about a regression modelthat analyzes the demand for cigarettes in the US states based on various factors such as cigarette price alcohol price unemployment rate and income per capi...
Get Instant Access to Expert-Tailored Solutions
See step-by-step solutions with expert insights and AI powered tools for academic success
Step: 2

Step: 3

Ace Your Homework with AI
Get the answers you need in no time with our AI-driven, step-by-step assistance
Get Started


