

Answered step by step
Verified Expert Solution
Question
1 Approved Answer
A study was done to look at the relationship between number of vacation days employees take each year and the number of sick days they
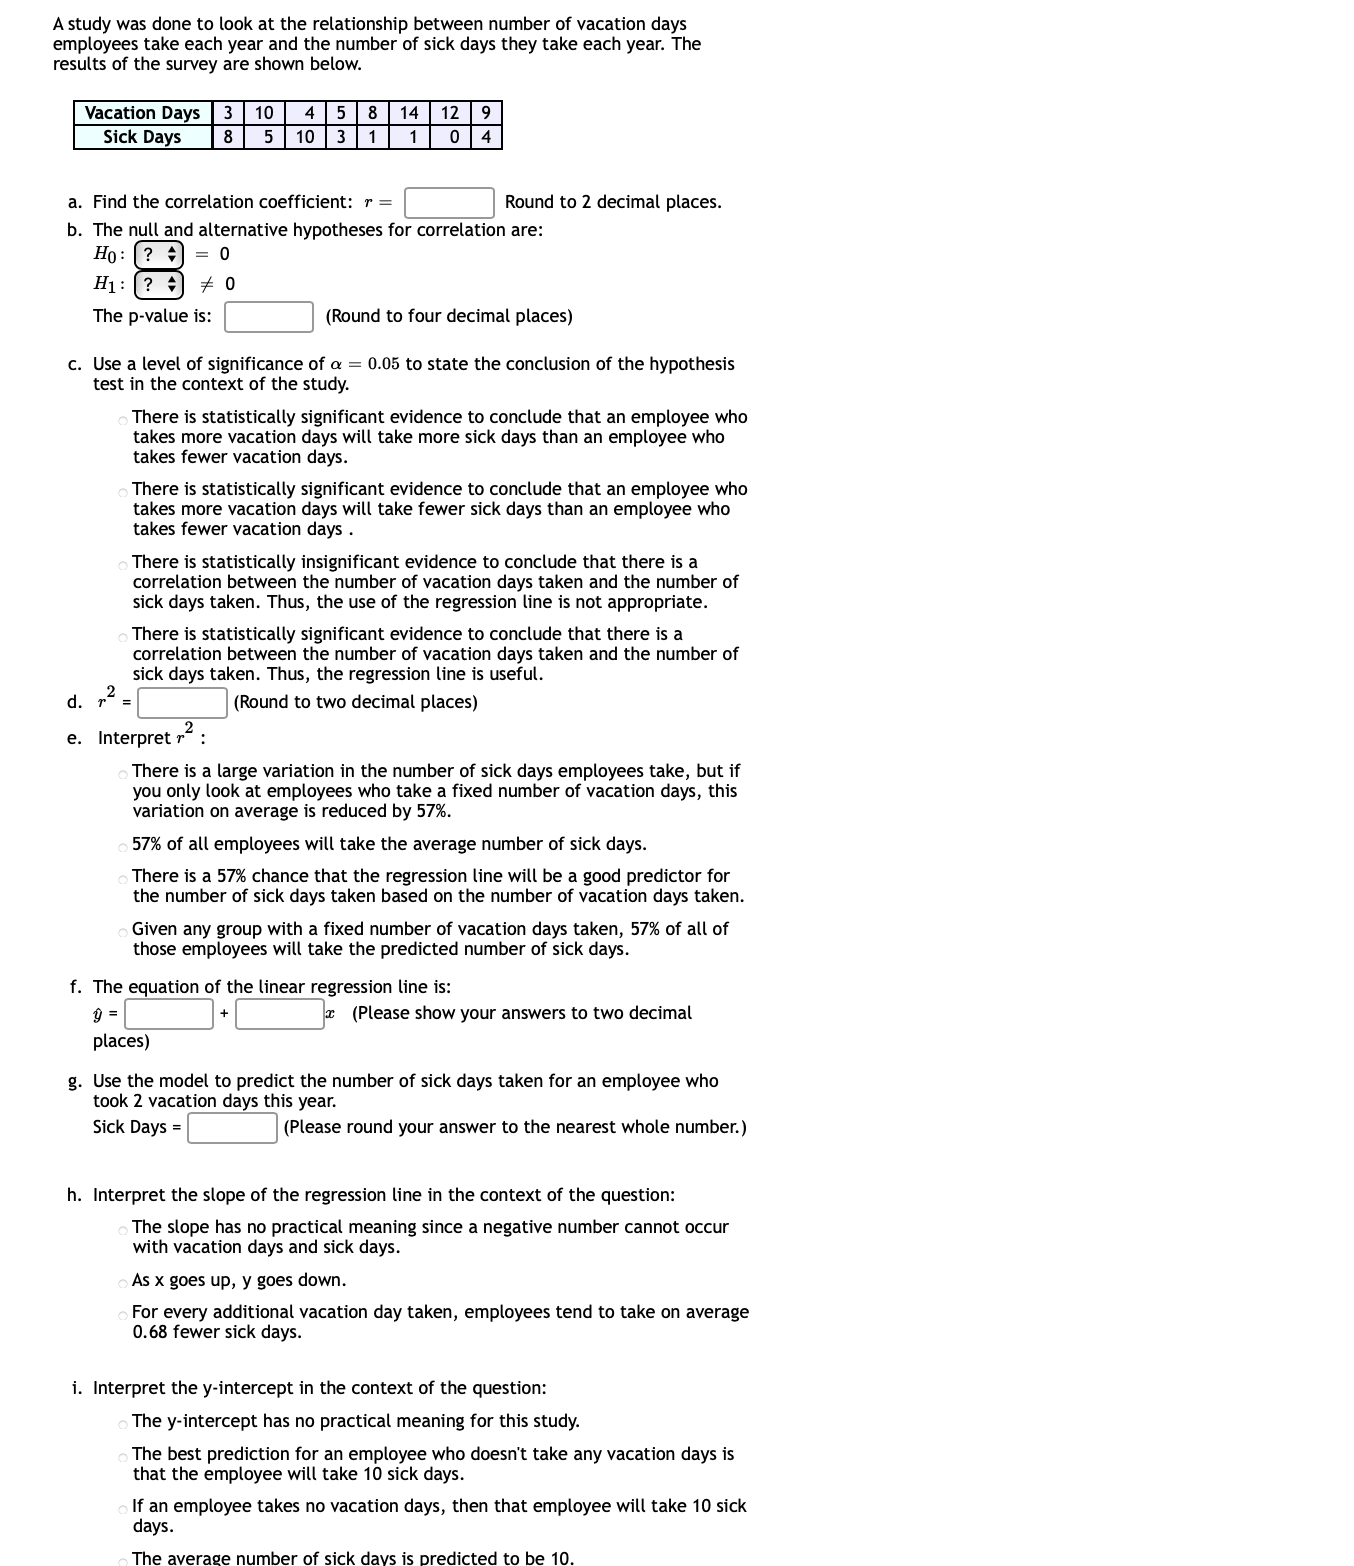 A study was done to look at the relationship between number of vacation days employees take each year and the number of sick days they take each year. The results of the survey are shown below. Ellllllll mailman-Inn a. Find the correlation coefficient: r = |:' Round to 2 decimal places. b. The null and alternative hypotheses for correlation are: H0:-=0 H1:- 740 The p-value is: C] (Round to four decimal places) c. Use a level of significance of o: = 0.05 to state the conclusion of the hypothesis test in the context of the study. There is statistically significant evidence to conclude that an employee who takes more vacation days will take more sick days than an employee who takes fewer vacation days. There is statistically significant evidence to conclude that an employee who takes more vacation days will take fewer sick days than an employee who takes fewer vacation days . There is statistically insignificant evidence to conclude that there is a correlation between the number of vacation days taken and the number of sick days taken. Thus, the use of the regression line is not appropriate. There is statistically significant evidence to conclude that there is a correlation between the number of vacation days taken and the number of sick days taken. Thus, the regression line is useful. d. 1'2 = I] (Found to two decimal places} 2 e. lnterpretr : There is a large variation in the number of sick days employees take, but if you only look at employees who take a fixed number of vacation days, this variation on average is reduced by 57%. 57% of all employees will take the average number of sick days. There is a 57% chance that the regression line will be a good predictor for the number of sick days taken based on the number of vacation days taken. Given any group with a fixed number of vacation days taken, 57% of all of those employees will take the predicted number of sick days. f. The equation of the linear regression line is: g = C] + C]: (Please show your answers to two decimal places) g. Use the model to predict the number of sick days taken for an employee who took 2 vacation days this year. Sick Days = C] (Please round your answer to die nearest whole number.) h. Interpret the slope of the regression line in the context of the question: The slope has no practical meaning since a negative number cannot occur with vacation days and sick days. As 5: goes up, y goes down. For every additional vacation day taken, employees tend to take on average 0.66 fewer sick days. i. Interpret the y-intercept in the context of the question: The y-intercept has no practical meaning for this study. The best prediction for an employee who doesn't take any vacation days is that the employee will take 10 sick days. If an employee takes no vacation days, then that employee will take 10 sick days. The average number of sick days is predicted to be 10
 Step by Step Solution
There are 3 Steps involved in it
Step: 1

Get Instant Access to Expert-Tailored Solutions
See step-by-step solutions with expert insights and AI powered tools for academic success
Step: 2

Step: 3
Ace Your Homework with AI
Get the answers you need in no time with our AI-driven, step-by-step assistance
Get Started
Algebra And Trigonometry Enhanced With Graphing Utilities (Subscription)
Authors: Michael, Michael Sullivan III, Michael III Sullivan, Michael Sullivan 111, III Sullivan
6th Edition
0321849132, 9780321849137