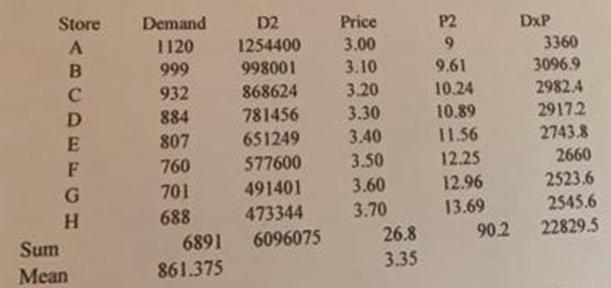
A supermarket chain wanted to know whether there was any relationship between the price (in dollars) set by the chain for its in-house brand of
A supermarket chain wanted to know whether there was any relationship between the price (in dollars) set by the chain for its in-house brand of coffee and demand (measured in pounds of coffee). Eight stores in the chain that had nearly equal past histories of demand for this brand of coffee were used in the study. Eight different prices were randomly assigned to the stores (one price per store) and an identical ad campaign was run in each market. The number of pounds of coffee sold during the following week was recorded for each store (see below).

(a) [3 marks] What is the coefficient of correlation in this situation? Explain what it means.
(b) [10 marks – 2,2,1,3,2] Is there a significant relationship between demand and price? (Do a complete analysis to justify your conclusions here.) Explain. Use the classical method of testing hypotheses and α = 5%. To find out if this correlation is significant, we must perform a hypothesis test.
1. Hyps: 2. Test: 3. Decision Rule 4. Analysis5. Conclusion:
(c) [10 marks – 2,2,1,3,2] Does price predict demand for this coffee? Explain. Assume α = 5% and use the classical method of testing hypotheses.
1. Hyps: 2. Test: 3. Decision Rule 4. Analysis5. Conclusion:
(d) [3 marks] What is the least squares prediction equation (i.e., the regression equation) here for predicting demand?
(e) [1 mark] Are you justified in using the regression equation to make predictions? Explain.
(f) [1 mark] Is there a straight-line relationship between price and demand for this coffee? Explain.
(g) [2 marks] The chain had been contemplating selling this coffee for $3.99 per pound. Use the regression equation to predict what demand in one of these stores would have been at this price.
(h) [2 marks] In making your prediction for this price of $3.99, did you violate any conditions which must be adhered to when using regression techniques to make predictions? Explain briefly.
(i) [2 marks] What is the coefficient of determination in this situation? Explain what it means.
(j) [2 marks; 05 each] What assumptions did you have to make to answer part (e)?
(k) [2 marks] What is the percentage of total variation in demand that is not explained by the prediction equation (SSE) (i.e., what is the error variation here)?
(l) [2 marks] What do the coefficients in the regression equation mean? Explain what each of the 2 coefficients mean.
(m) [1 mark] What is the standard error of estimate in this example?
(n) [3 marks] What is the 95% confidence interval for demand if a store were to price its coffee at $3.00 per pound? (o) [3 marks] What is the 95% confidence interval for average demand of all stores offering their coffee at $3.00 per pound?
Store A B C D E F G H Sum Mean Demand 1120 999 932 884 807 760 701 688 6891 861.375 D2 1254400 998001 868624 781456 651249 577600 491401 473344 6096075 Price 3.00 3.10 3.20 3.30 3.40 3.50 3.60 3.70 26.8 3.35 P2 9 9.61 10.24 10.89 11.56 12.25 12.96 13.69 90.2 DxP 3360 3096.9 2982.4 29172 2743.8 2660 2523.6 2545.6 22829.5
Step by Step Solution
3.30 Rating (176 Votes )
There are 3 Steps involved in it
Step: 1
A Correlation coefficient Correlation coefficient r From the given table it is know that n 8 x 268 6...
See step-by-step solutions with expert insights and AI powered tools for academic success
Step: 2

Step: 3

Ace Your Homework with AI
Get the answers you need in no time with our AI-driven, step-by-step assistance
Get Started


