

Answered step by step
Verified Expert Solution
Question
1 Approved Answer
a) The following data shows the quarterly number of passengers who used KQ airplanes in 3 consecutive years; 1 Quarter 1 2 3 4 2014
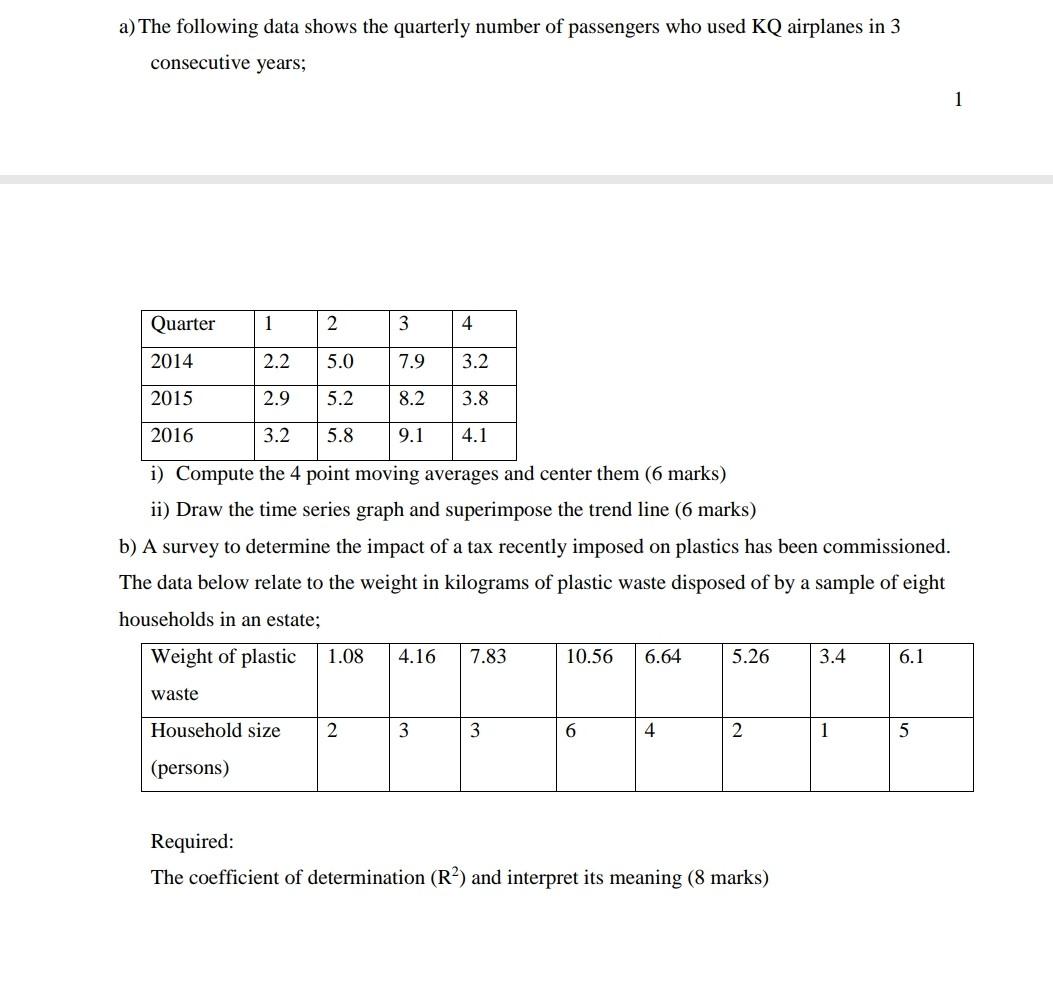
a) The following data shows the quarterly number of passengers who used KQ airplanes in 3 consecutive years; 1 Quarter 1 2 3 4 2014 2.2 5.0 7.9 3.2 2015 2.9 5.2 8.2 3.8 2016 3.2 5.8 9.1 4.1 i) Compute the 4 point moving averages and center them (6 marks) ii) Draw the time series graph and superimpose the trend line (6 marks) b) A survey to determine the impact of a tax recently imposed on plastics has been commissioned. The data below relate to the weight in kilograms of plastic waste disposed of by a sample of eight households in an estate; Weight of plastic 1.08 4.16 7.83 10.56 6.64 5.26 3.4 6.1 waste Household size 2 3 3 6 4 2 1 5 (persons) Required: The coefficient of determination (RP) and interpret its meaning (8 marks) a) The following data shows the quarterly number of passengers who used KQ airplanes in 3 consecutive years; 1 Quarter 1 2 3 4 2014 2.2 5.0 7.9 3.2 2015 2.9 5.2 8.2 3.8 2016 3.2 5.8 9.1 4.1 i) Compute the 4 point moving averages and center them (6 marks) ii) Draw the time series graph and superimpose the trend line (6 marks) b) A survey to determine the impact of a tax recently imposed on plastics has been commissioned. The data below relate to the weight in kilograms of plastic waste disposed of by a sample of eight households in an estate; Weight of plastic 1.08 4.16 7.83 10.56 6.64 5.26 3.4 6.1 waste Household size 2 3 3 6 4 2 1 5 (persons) Required: The coefficient of determination (RP) and interpret its meaning (8 marks)
Step by Step Solution
There are 3 Steps involved in it
Step: 1

Get Instant Access to Expert-Tailored Solutions
See step-by-step solutions with expert insights and AI powered tools for academic success
Step: 2

Step: 3
Ace Your Homework with AI
Get the answers you need in no time with our AI-driven, step-by-step assistance
Get Started
The Everything Guide To Day Trading
Authors: David Borman
1st Edition
1440506213, 978-1440506215