

Question
a) The phase diagram that emerges when element B is added to element A is given in the figure. Considering this phase diagram, 3 samples
a) The phase diagram that emerges when element B is added to element A is given in the figure. Considering this phase diagram, 3 samples were cut from the same material for the case containing 5% B element. Suppose they have the same grain size in the initial state. 3 samples of 5% composition material are placed in 3 ovens separately. The heat treatment is carried out at the same time as the 1st sample at T3 temperature in the 1st oven, the 2nd sample at the T2 temperature in the 2nd oven, and the 3rd sample at the T1 temperature in the 3rd oven. Show the grain growth time graph of these on the same graph. b) For the Ti temperature, show the grain growth-time graph of the materials containing 2% and 5% B on the same graph. c) Are the grain growth kinetics of the element A and the alpha element the same? Or is it different? Please explain. d) Compare the grain growth kinetics of alpha and alpha+beta phases at the same temperature.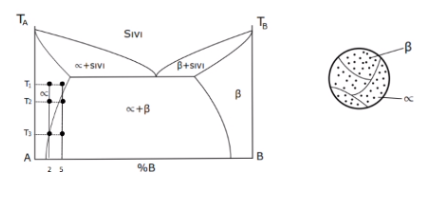
Step by Step Solution
There are 3 Steps involved in it
Step: 1

Get Instant Access to Expert-Tailored Solutions
See step-by-step solutions with expert insights and AI powered tools for academic success
Step: 2

Step: 3
Ace Your Homework with AI
Get the answers you need in no time with our AI-driven, step-by-step assistance
Get Started
Introduction To Chemical Engineering Analysis Using Mathematica
Authors: Henry C. Foley
1st Edition
0122619129, 978-0122619120