Answered step by step
Verified Expert Solution
Question
1 Approved Answer
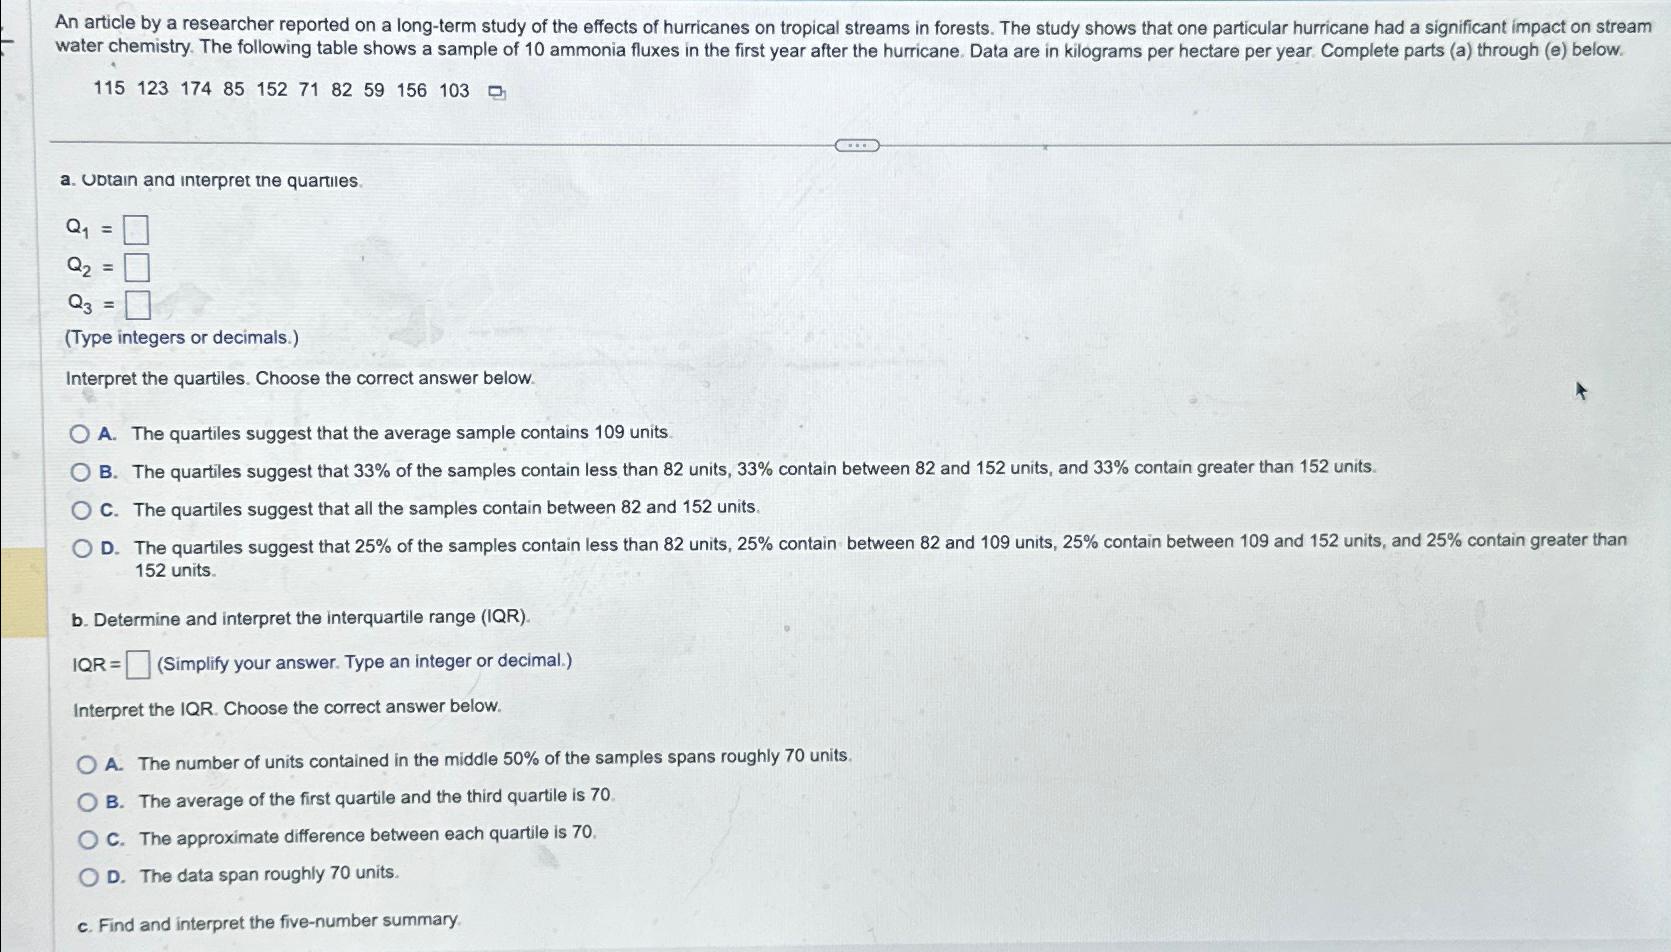
a . UDtain and interpret the quartiles. Q 1 = Q 2 = Q 3 = ( Type integers or decimals. ) Interpret the quartiles.
a UDtain and interpret the quartiles.
Type integers or decimals.
Interpret the quartiles. Choose the correct answer below.
A The quartiles suggest that the average sample contains units
B The quartiles suggest that of the samples contain less than units, contain between and units, and contain greater than units.
C The quartiles suggest that all the samples contain between and units. units.
b Determine and interpret the interquartile range IQR
IQRSimplify your answer. Type an integer or decimal.
Interpret the IQR. Choose the correct answer below.
A The number of units contained in the middle of the samples spans roughly units.
B The average of the first quartile and the third quartile is
C The approximate difference between each quartile is
D The data span roughly units.
c Find and interpret the fivenumber summary.

Step by Step Solution
There are 3 Steps involved in it
Step: 1

Get Instant Access to Expert-Tailored Solutions
See step-by-step solutions with expert insights and AI powered tools for academic success
Step: 2

Step: 3

Ace Your Homework with AI
Get the answers you need in no time with our AI-driven, step-by-step assistance
Get Started


