

Answered step by step
Verified Expert Solution
Question
1 Approved Answer
a. Use the spreadsheet to calculate as many of the company's profitability, turnover-control, and leverage and liquidity ratios as you can for these years (see
a. Use the spreadsheet to calculate as many of the company's profitability, turnover-control, and leverage and liquidity ratios as you can for these years (see Table 2.4 in text for a list of possible ratios) 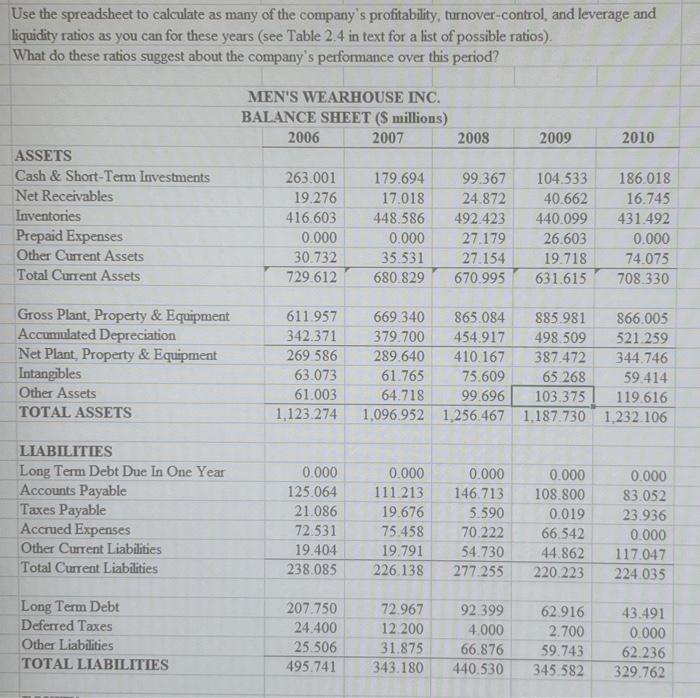
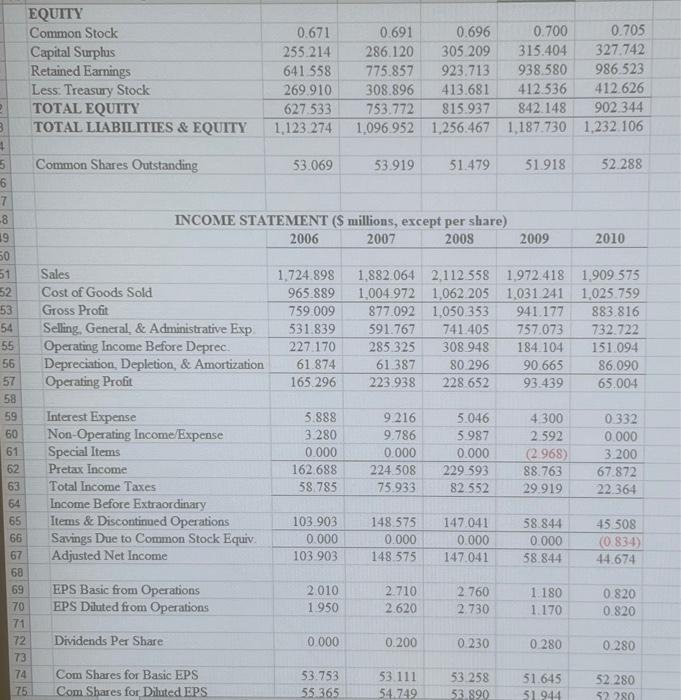
Use the spreadsheet to calculate as many of the company's profitability, turnover-control, and leverage and liquidity ratios as you can for these years (see Table 2.4 in text for a list of possible ratios). What do these ratios suggest about the company's performance over this period? MEN'S WEARHOUSE INC. BALANCE SHEET ( $ millions) \begin{tabular}{|c|c|c|c|c|c|} \hline & 2006 & 2007 & 2008 & 2009 & 2010 \\ \hline \multicolumn{6}{|l|}{ ASSETS } \\ \hline Cash \& Short-Term Investments & 263.001 & 179.694 & 99.367 & 104.533 & 186.018 \\ \hline Net Receivables & 19.276 & 17.018 & 24.872 & 40.662 & 16.745 \\ \hline Inventories & 416.603 & 448.586 & 492.423 & 440.099 & 431.492 \\ \hline Prepaid Expenses & 0.000 & 0.000 & 27.179 & 26.603 & 0.000 \\ \hline Other Current Assets & 30.732 & 35.531 & 27.154 & 19.718 & 74.075 \\ \hline Total Current Assets & 729.612 & 680.829 & 670.995 & 631.615 & 708.330 \\ \hline Gross Plant, Property \& Equipment & 611.957 & 669.340 & 865.084 & 885.981 & 866.005 \\ \hline Accumulated Depreciation & 342.371 & 379.700 & 454.917 & 498.509 & 521.259 \\ \hline Net Plant, Property \& Equipment & 269.586 & 289.640 & 410.167 & 387.472 & 344.746 \\ \hline Intangibles & 63.073 & 61.765 & 75.609 & 65.268 & 59.414 \\ \hline Other Assets & 61.003 & 64.718 & 99.696 & 103.375 & 119.616 \\ \hline TOTAL ASSETS & 1,123.274 & 1,096.952 & 1,256.467 & 1,187.730 & 1,232.106 \\ \hline \multicolumn{6}{|l|}{ LIABILITIES } \\ \hline Long Term Debt Due In One Year & 0.000 & 0.000 & 0.000 & 0.000 & 0.000 \\ \hline Accounts Payable & 125.064 & 111.213 & 146.713 & 108.800 & 83.052 \\ \hline Taxes Payable & 21.086 & 19.676 & 5.590 & 0.019 & 23.936 \\ \hline Accrued Expenses & 72.531 & 75.458 & 70.222 & 66.542 & 0.000 \\ \hline Other Current Liabilities & 19.404 & 19.791 & 54.730 & 44.862 & 117.047 \\ \hline Total Current Liabilities & 238.085 & 226.138 & 277.255 & 220.223 & 224.035 \\ \hline & & & & & \\ \hline Long Term Debt & 207.750 & 72.967 & 92.399 & 62.916 & 43.491 \\ \hline Deferred Taxes & 24.400 & 12.200 & 4.000 & 2.700 & 0.000 \\ \hline Other Liabilities & 25.506 & 31.875 & 66.876 & 59.743 & 62.236 \\ \hline TOTAL LIABILITIES & 495.741 & 343.180 & 440.530 & 345.582 & 329.762 \\ \hline \end{tabular} EQUITY \begin{tabular}{|l|r|r|r|r|r|} \hline Common Stock & 0.671 & 0.691 & 0.696 & 0.700 & 0.705 \\ \hline Capital Surphus & 255.214 & 286.120 & 305.209 & 315.404 & 327.742 \\ \hline Retained Earnings & 641.558 & 775.857 & 923.713 & 938.580 & 986.523 \\ \hline Less. Treasury Stock & 269.910 & 308.896 & 413.681 & 412.536 & 412.626 \\ \hline TOTAL EQUITY & 627.533 & 753.772 & 815.937 & 842.148 & 902.344 \\ \hline TOTAL LIABILITIES \& EQUITY & 1,123.274 & 1,096.952 & 1,256.467 & 1,187.730 & 1,232.106 \\ \hline \end{tabular} Common Shares Outstanding 53.069 53.919 51.479 51918 52.288 \begin{tabular}{|c|c|c|c|c|c|c|} \hline & & & & & & \\ \hline & & & & & & \\ \hline & \multicolumn{6}{|c|}{ INCOME STATEMENT (\$ millions, except per share) } \\ \hline & & 2006 & 2007 & 2008 & 2009 & 2010 \\ \hline & & & & & & \\ \hline & Sales & 1,724.898 & 1,882.064 & 2,112.558 & 1,972.418 & 1,909.575 \\ \hline & Cost of Goods Sold & 965.889 & 1.004972 & 1,062.205 & 1,031.241 & 1.025 .759 \\ \hline & Gross Profit & 759.009 & 877.092 & 1,050353 & 941.177 & 883.816 \\ \hline & Selling, General, \& Administrative Exp. & 531.839 & 591.767 & 741.405 & 757.073 & 732.722 \\ \hline & Operating Income Before Deprec. & 227.170 & 285.325 & 308.948 & 184.104 & 151.094 \\ \hline & Depreciation, Depletion, \& Amortization & 61.874 & 61387 & 80.296 & 90.665 & 86.090 \\ \hline & Operafing Profit & 165.296 & 223.938 & 228652 & 93.439 & 65.004 \\ \hline & & & & & & \\ \hline 59 & Interest Expense & 5.888 & 9.216 & 5.046 & 4.300 & 0.332 \\ \hline 60 & Non-Operating Income/Expense & 3280 & 9.786 & 5.987 & 2592 & 0.000 \\ \hline 61 & Special Items & 0.000 & 0.000 & 0.000 & (2968) & 3200 \\ \hline 62 & Pretax Income & 162.688 & 224.508 & 229593 & 88.763 & 67.872 \\ \hline 63 & Total lncome Taxes & 58.785 & 75.933 & 82.552 & 29.919 & 22.364 \\ \hline 64 & Income Before Extraordinary & & & & & \\ \hline 65 & Items \& Discontinned Operations & 103.903 & 148.575 & 147.041 & 58.844 & 45.508 \\ \hline 66 & Savings Due to Common Stock Equiv. & 0.000 & 0.000 & 0.000 & 0.000 & (0.834) \\ \hline 67 & Adjusted Net Income & 103.903 & 148.575 & 147.041 & 58.844 & 44.674 \\ \hline 68 & & & & & & \\ \hline 69 & EPS Basic from Operations & 2010 & 2.710 & 2760 & 1.180 & 0.820 \\ \hline 70 & EPS Diluted from Operations & 1950 & 2.620 & 2.730 & 1.170 & 0.820 \\ \hline 71 & & & & & & \\ \hline 72 & Dividends Per Share & 0.000 & 0.200 & 0.230 & 0.280 & 0.280 \\ \hline 73 & & & & & & \\ \hline 74 & Com Shares for Basic EPS & 53.753 & 53.111 & 53.258 & 51.645 & 52.280 \\ \hline & are & 55.365 & 4.740 & & & \\ \hline \end{tabular} b. What do these ratios suggest about the company's performance over this period?
Step by Step Solution
There are 3 Steps involved in it
Step: 1

Get Instant Access to Expert-Tailored Solutions
See step-by-step solutions with expert insights and AI powered tools for academic success
Step: 2

Step: 3
Ace Your Homework with AI
Get the answers you need in no time with our AI-driven, step-by-step assistance
Get Started
Shipping Finance A Practical Handbook
Authors: Stephenson Harwood
4th Edition
1787421406, 978-1787421400