Question
a. What is the expected return of investing equally in all three assets M, N, and O? ________ (Round to two decimal places.) What is

a. What is the expected return of investing equally in all three assets M, N, and O?
________
(Round to two decimal places.)
What is the expected return of investing in asset M alone?
________
(Round to two decimal places.)
What is the standard deviation of the portfolio that invests equally in all three assets M, N, and O?
__________
(Round to two decimal places.)
What is the standard deviation of asset M?
_________
(Round to two decimal places.)
By investing in the portfolio that invests equally in all three assets M, N, and O rather than asset M alone, Sally can benefit by increasing her return by
________ %
and decrease her risk by
_________ %.
(Round to two decimal places.)
b. What is the expected return of a portfolio of 50% asset M and 50% asset N?
___________ %
(Round to two decimal places.)
What is the expected return of a portfolio of 50% asset M and 50% asset O?
______ %
(Round to two decimal places.)
What is the expected return of a portfolio of 50% asset N and 50% asset O?
______ %
(Round to two decimal places.)
What is the standard deviation of a portfolio of 50% asset M and 50% asset N?
_______ %
(Round to two decimal places.)
What is the standard deviation of a portfolio of 50% asset M and 50% asset O?
___________ %
(Round to two decimal places.)
What is the standard deviation of a portfolio of 50% asset N and 50% asset O?
_____%
(Round to two decimal places.)
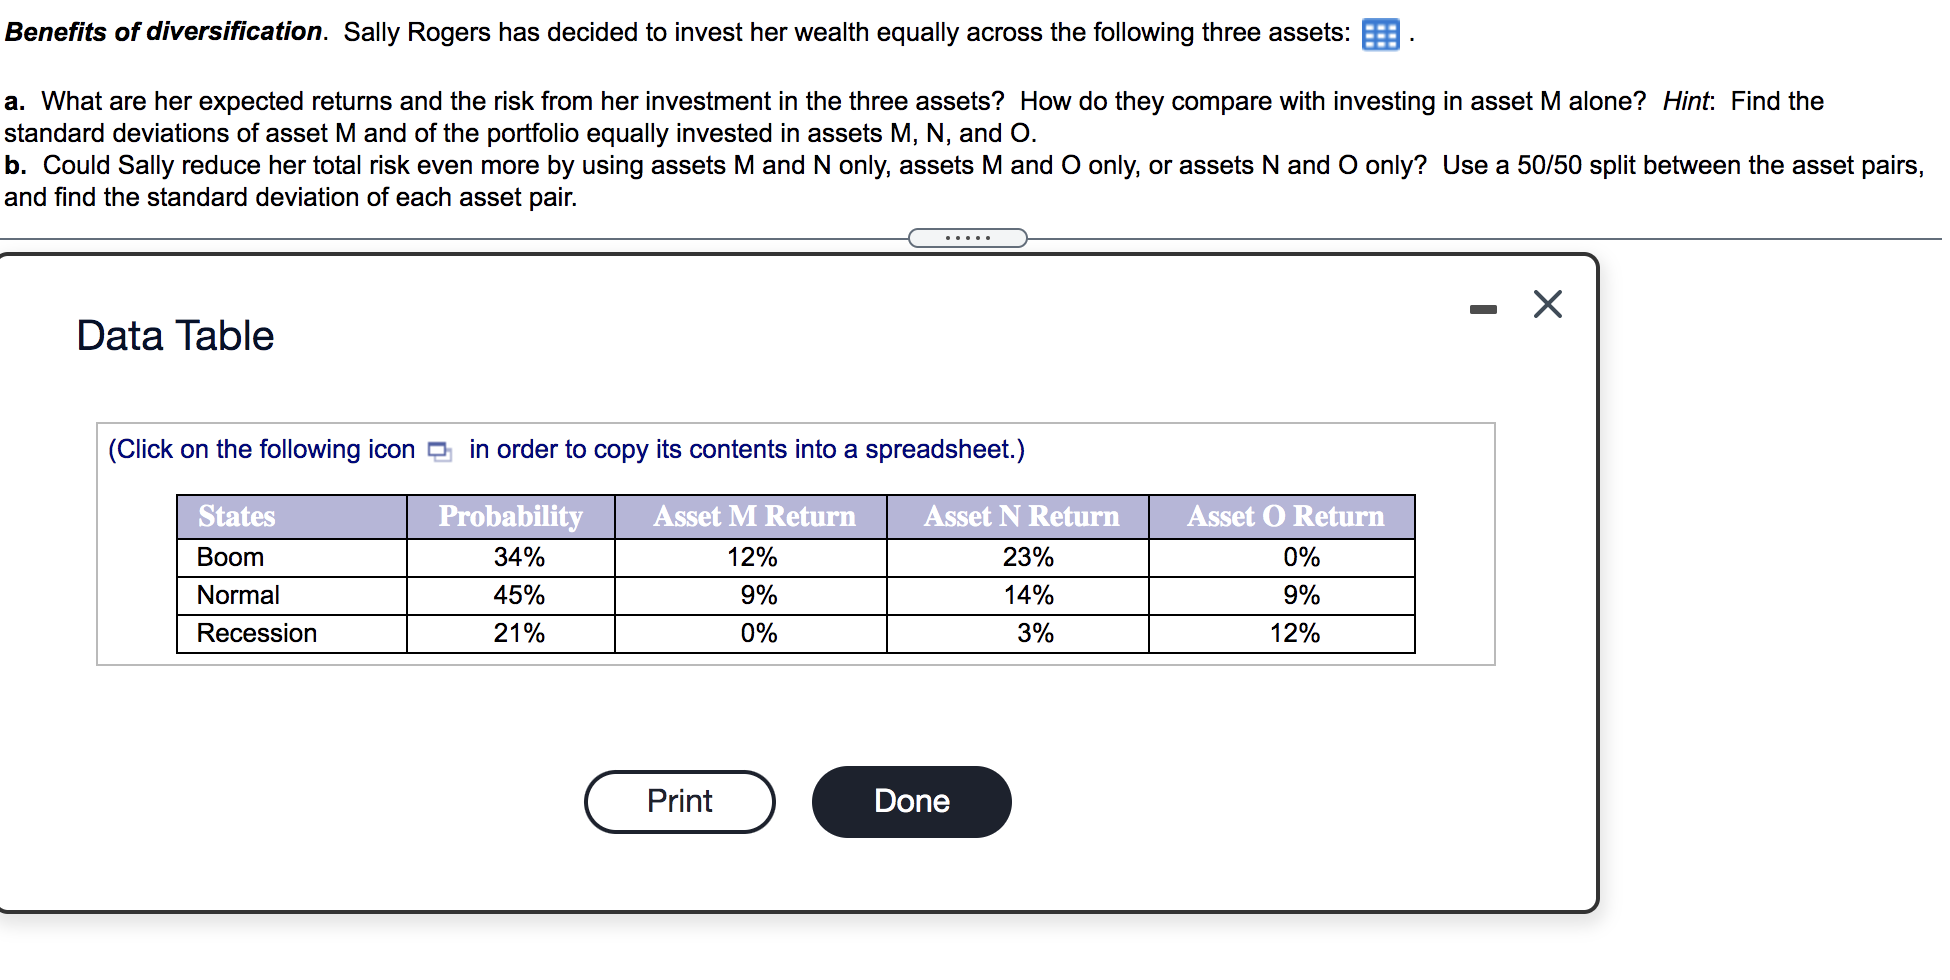
Benefits of diversification. Sally Rogers has decided to invest her wealth equally across the following three assets: a. What are her expected returns and the risk from her investment in the three assets? How do they compare with investing in asset Malone? Hint: Find the standard deviations of asset M and of the portfolio equally invested in assets M, N, and O. b. Could Sally reduce her total risk even more by using assets M and N only, assets M and O only, or assets N and O only? Use a 50/50 split between the asset pairs, and find the standard deviation of each asset pair. Data Table (Click on the following icon in order to copy its contents into a spreadsheet.) States Boom Probability 34% 45% 21% Asset M Return 12% 9% Asset N Return 23% 14% 3% Asset O Return 0% 9% Normal Recession 0% 12% Print DoneStep by Step Solution
There are 3 Steps involved in it
Step: 1

Get Instant Access to Expert-Tailored Solutions
See step-by-step solutions with expert insights and AI powered tools for academic success
Step: 2

Step: 3

Ace Your Homework with AI
Get the answers you need in no time with our AI-driven, step-by-step assistance
Get Started


