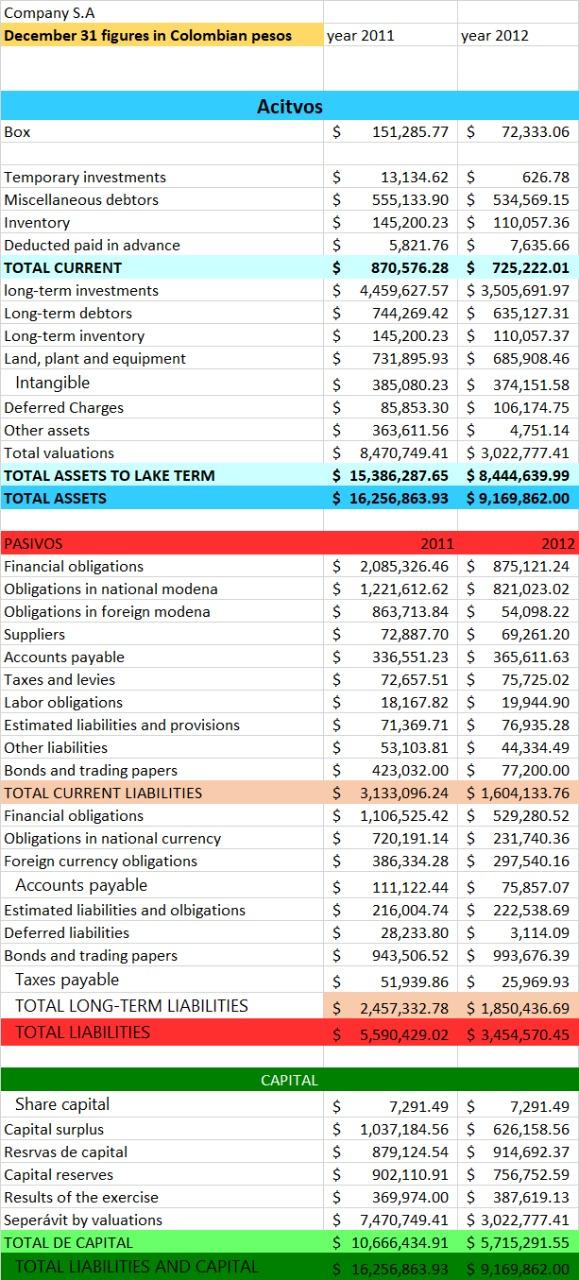
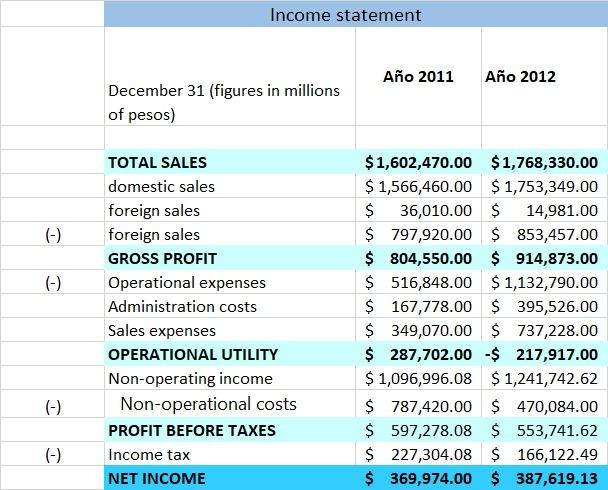
A.- Within the expansionist policy of the company, it is planned to enter the Mexican market during the year 2017. For this, it is required to present to the board of directors, the projection of the financial statements of the company from the year 2013 to 2016, in figures in Mexican pesos, therefore, you must change the currency rate from Colombian pesos to Mexican pesos by taking an exchange rate equivalent to 1 Mexican peso (MXN) per 150 Colombian pesos (COP) and use the inflation indicators provided in the projection assumptions box

B.- It is required to present to the board of directors, the projection of the financial statements of the company for the year 2017, in which there is evidence of a growth in sales corresponding to 22%, as well as a growth in the cost of sales of 7%. compared to the year 2016, which affects the income statement for the year 2017 and therefore the net income. For this you must take into account that: -A modification in sales caused by market factors, makes anticipate changes in the cost of production or cost of sales that affects a profit before taxes, which serves as a basis for the settlement of taxes, an aspect that generates income for the country. , without losing sight of the net income received by the company, its reason for being. -You must determine how the result of this expansion benefits the Mexican economy, as well as what monetary and fiscal benefits it receives.
C.- Based on the projection made for the years 2016 and 2017, you should consider that in order to carry out an expansion such as the one proposed in the initial paragraph, the company must resort to indebtedness equivalent to 5% of total assets. This credit will be agreed with a foreign bank, at a rate equivalent to 6% annual effective, with a term of 7 years agreed in dollars at the 2016 exchange rate, according to the table of assumptions provided. To do this, it calculates the WACC indicator for the years 2016 and 2017 and shows in the financial statement, the general balance of 2017 with the indebtedness and in the financial statement of results of 2017, the modified sales and cost of sales.


2016 2018 Scenearios Rate of inflation bank funding interest rate to January average bank fund interest rate for one year US dollar exchange rate as of December 31 ISR Monetary and fiscal policy 2013 2014 2015 3.25% 4.48% 2.13% 4.50% 3.49% 3.37% 3.98% 3.33% 3.05% 13.08 14.74 17.24 30.00% 30.00% 35.00% 3.36% 5.78% 4.16% 20.61 35.00% 2017 6.77% 6.26% 6.71% 19.66 35.00% 4.80% 7.26% 7.69% 19.65 35.00% Company S.A December 31 figures in Colombian pesos year 2011 year 2012 Acitvos $ Box 151,285.77 $ 72,333.06 Temporary investments Miscellaneous debtors Inventory Deducted paid in advance TOTAL CURRENT long-term investments Long-term debtors Long-term inventory Land, plant and equipment Intangible Deferred Charges Other assets Total valuations TOTAL ASSETS TO LAKE TERM TOTAL ASSETS $ 13,134.62 $ 626.78 $ 555,133.90 $ 534,569.15 $ 145,200.23 $ 110,057.36 $ 5,821.76 $ 7,635.66 $ 870,576.28 $ 725,222.01 $ 4,459,627.57 $ 3,505,691.97 $ 744,269.42 $ 635,127.31 $ 145,200.23 $ 110,057.37 $ 731,895.93 $ 685,908.46 $ 385,080.23 $ 374,151.58 $ 85,853.30 $ 106,174.75 $ 363,611.56 $ 4,751.14 $ 8,470,749.41 $ 3,022,777.41 $ 15,386,287.65 $8,444,639.99 $ 16,256,863.93 $ 9,169,862.00 PASIVOS Financial obligations Obligations in national modena Obligations in foreign modena Suppliers Accounts payable Taxes and levies Labor obligations Estimated liabilities and provisions Other liabilities Bonds and trading papers TOTAL CURRENT LIABILITIES Financial obligations Obligations in national currency Foreign currency obligations Accounts payable Estimated liabilities and olbigations Deferred liabilities Bonds and trading papers Taxes payable TOTAL LONG-TERM LIABILITIES TOTAL LIABILITIES 2011 2012 $ 2,085,326.46 $ 875,121.24 $ 1,221,612.62 $ 821,023.02 $ 863,713.84 $ 54,098.22 $ 72,887.70 $ 69,261.20 $ 336,551.23 $ 365,611.63 $ 72,657.51 $ 75,725.02 $ 18,167.82 $ 19,944.90 $ 71,369.71 $ 76,935.28 $ 53,103.81 $ 44,334.49 $ 423,032.00 $ 77,200.00 $ 3,133,096.24 $ 1,604,133.76 $ 1,106,525.42 $ 529,280.52 $ 720,191.14 $ 231,740.36 $ 386,334.28 $ 297,540.16 $ 111,122.44 $ 75,857.07 $ 216,004.74 $ 222,538.69 $ 28,233.80 $ 3,114.09 $ 943,506.52 $ 993,676.39 $ 51,939.86 $ 25,969.93 $ 2,457,332.78 $ 1,850,436.69 $ 5,590,429.02 $3,454,570.45 CAPITAL Share capital Capital surplus Resrvas de capital Capital reserves Results of the exercise Sepervit by valuations TOTAL DE CAPITAL TOTAL LIABILITIES AND CAPITAL $ 7,291.49 $ 7,291.49 $ 1,037,184.56 $ 626,158.56 $ 879,124.54 $ 914,692.37 $ 902,110.91 $ 756,752.59 $ 369,974.00 $ 387,619.13 $ 7,470,749.41 $ 3,022,777.41 $ 10,666,434.91 $5,715,291.55 $ 16,256,863.93 S 9,169,862.00 Income statement Ao 2011 Ao 2012 December 31 (figures in millions of pesos) (-) (-) TOTAL SALES domestic sales foreign sales foreign sales GROSS PROFIT Operational expenses Administration costs Sales expenses OPERATIONAL UTILITY Non-operating income Non-operational costs PROFIT BEFORE TAXES Income tax NET INCOME $1,602,470.00 $1,768,330.00 $ 1,566,460.00 $ 1,753,349.00 $ 36,010.00 $ 14,981.00 $ 797,920.00 $ 853,457.00 $ 804,550.00 $ 914,873.00 $ 516,848.00 $ 1,132,790.00 $ 167,778.00 $ 395,526.00 $ 349,070.00 $ 737,228.00 $ 287,702.00 - $ 217,917.00 $ 1,096,996.08 $ 1,241,742.62 $ 787,420.00 $ 470,084.00 $ 597,278.08 $ 553,741.62 $ 227,304.08 $ 166,122.49 $ 369,974.00 $ 387,619.13 (-) (-) 2016 2018 Scenearios Rate of inflation bank funding interest rate to January average bank fund interest rate for one year US dollar exchange rate as of December 31 ISR Monetary and fiscal policy 2013 2014 2015 3.25% 4.48% 2.13% 4.50% 3.49% 3.37% 3.98% 3.33% 3.05% 13.08 14.74 17.24 30.00% 30.00% 35.00% 3.36% 5.78% 4.16% 20.61 35.00% 2017 6.77% 6.26% 6.71% 19.66 35.00% 4.80% 7.26% 7.69% 19.65 35.00% Company S.A December 31 figures in Colombian pesos year 2011 year 2012 Acitvos $ Box 151,285.77 $ 72,333.06 Temporary investments Miscellaneous debtors Inventory Deducted paid in advance TOTAL CURRENT long-term investments Long-term debtors Long-term inventory Land, plant and equipment Intangible Deferred Charges Other assets Total valuations TOTAL ASSETS TO LAKE TERM TOTAL ASSETS $ 13,134.62 $ 626.78 $ 555,133.90 $ 534,569.15 $ 145,200.23 $ 110,057.36 $ 5,821.76 $ 7,635.66 $ 870,576.28 $ 725,222.01 $ 4,459,627.57 $ 3,505,691.97 $ 744,269.42 $ 635,127.31 $ 145,200.23 $ 110,057.37 $ 731,895.93 $ 685,908.46 $ 385,080.23 $ 374,151.58 $ 85,853.30 $ 106,174.75 $ 363,611.56 $ 4,751.14 $ 8,470,749.41 $ 3,022,777.41 $ 15,386,287.65 $8,444,639.99 $ 16,256,863.93 $ 9,169,862.00 PASIVOS Financial obligations Obligations in national modena Obligations in foreign modena Suppliers Accounts payable Taxes and levies Labor obligations Estimated liabilities and provisions Other liabilities Bonds and trading papers TOTAL CURRENT LIABILITIES Financial obligations Obligations in national currency Foreign currency obligations Accounts payable Estimated liabilities and olbigations Deferred liabilities Bonds and trading papers Taxes payable TOTAL LONG-TERM LIABILITIES TOTAL LIABILITIES 2011 2012 $ 2,085,326.46 $ 875,121.24 $ 1,221,612.62 $ 821,023.02 $ 863,713.84 $ 54,098.22 $ 72,887.70 $ 69,261.20 $ 336,551.23 $ 365,611.63 $ 72,657.51 $ 75,725.02 $ 18,167.82 $ 19,944.90 $ 71,369.71 $ 76,935.28 $ 53,103.81 $ 44,334.49 $ 423,032.00 $ 77,200.00 $ 3,133,096.24 $ 1,604,133.76 $ 1,106,525.42 $ 529,280.52 $ 720,191.14 $ 231,740.36 $ 386,334.28 $ 297,540.16 $ 111,122.44 $ 75,857.07 $ 216,004.74 $ 222,538.69 $ 28,233.80 $ 3,114.09 $ 943,506.52 $ 993,676.39 $ 51,939.86 $ 25,969.93 $ 2,457,332.78 $ 1,850,436.69 $ 5,590,429.02 $3,454,570.45 CAPITAL Share capital Capital surplus Resrvas de capital Capital reserves Results of the exercise Sepervit by valuations TOTAL DE CAPITAL TOTAL LIABILITIES AND CAPITAL $ 7,291.49 $ 7,291.49 $ 1,037,184.56 $ 626,158.56 $ 879,124.54 $ 914,692.37 $ 902,110.91 $ 756,752.59 $ 369,974.00 $ 387,619.13 $ 7,470,749.41 $ 3,022,777.41 $ 10,666,434.91 $5,715,291.55 $ 16,256,863.93 S 9,169,862.00 Income statement Ao 2011 Ao 2012 December 31 (figures in millions of pesos) (-) (-) TOTAL SALES domestic sales foreign sales foreign sales GROSS PROFIT Operational expenses Administration costs Sales expenses OPERATIONAL UTILITY Non-operating income Non-operational costs PROFIT BEFORE TAXES Income tax NET INCOME $1,602,470.00 $1,768,330.00 $ 1,566,460.00 $ 1,753,349.00 $ 36,010.00 $ 14,981.00 $ 797,920.00 $ 853,457.00 $ 804,550.00 $ 914,873.00 $ 516,848.00 $ 1,132,790.00 $ 167,778.00 $ 395,526.00 $ 349,070.00 $ 737,228.00 $ 287,702.00 - $ 217,917.00 $ 1,096,996.08 $ 1,241,742.62 $ 787,420.00 $ 470,084.00 $ 597,278.08 $ 553,741.62 $ 227,304.08 $ 166,122.49 $ 369,974.00 $ 387,619.13 (-) (-)


