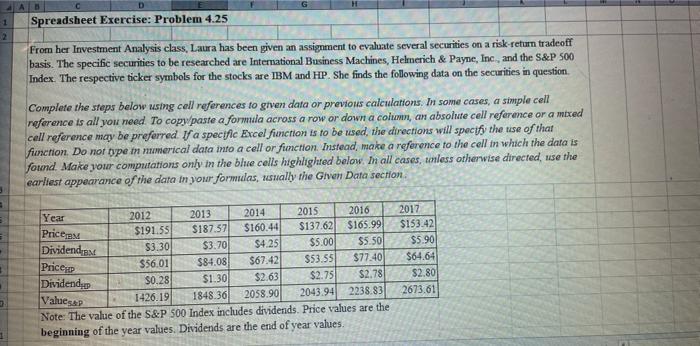
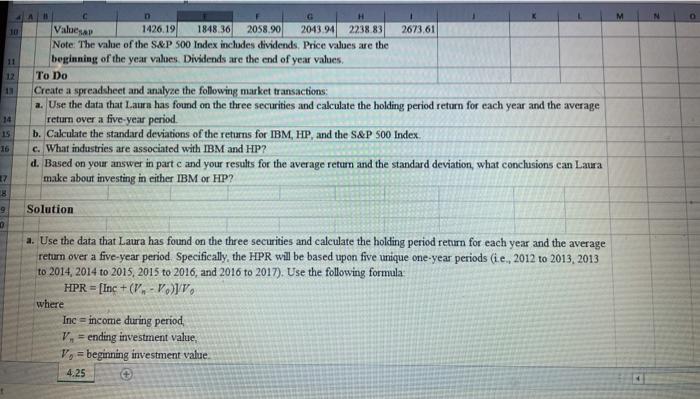
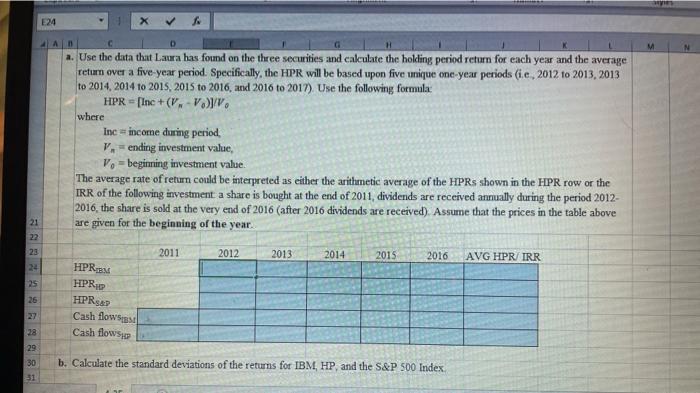
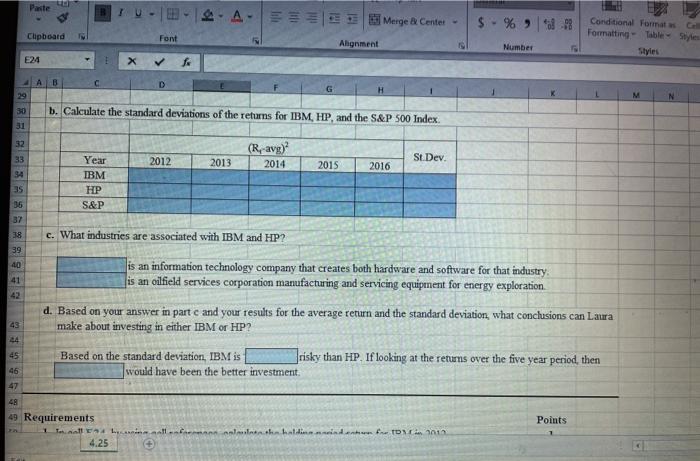
AB 1 Spreadsheet Exercise: Problem 4.25 From her Investment Analysis class, Laura has been given an assignment to evaluate several securities on a risk return tradeoff basis. The specific securities to be researched are International Business Machines, Helmerich & Payne, Inc., and the S&P 500 Index. The respective ticker symbols for the stocks are IBM and HP. She finds the following data on the securities in question Complete the steps below using cell references to given data or previous calculations. In some cases, a simple cell reference is all you need to copy/paste a formula across a row or down a column, an absolute cell reference or a mixed call reference may be preferred. If a specific Excel function is to be used the directions will specify the use of that finction. Do not type m numerical data into a cell or function. Instead, make a reference to the cell in which the data is found. Make your computations only in the blue cells highlighted below. In all cases, unless otherwise directed, use the earliest appearance of the data in your formidas, usually the Ghen Data section . Year Prices 2017 $153.42 $5.90 3 2012 2013 2014 2015 2016 $191.55 $187.57 $160.44 $137.62 $165.99 Dividendes $3.30 $3.70 $4.25 $5.00 $5.50 $56.01 Pricep $84.08 $67.42 $53.55 $77.40 $0.28 $1.30 Dividendy $2.63 $2.75 $2.78 1426.19 Valuesep 1848.36 2058.90 2043.94 2238.83 Note: The value of the S&P 500 Index includes dividends. Price values are the beginning of the year values. Dividends are the end of year values. $64.64 $2.80 2673.61 18 11 12 13 Valuesap 1426.19 1848.36 2058.90 2043.94 2238.83 2673.61 Note: The value of the S&P 500 Index includes dividends. Price values are the beginning of the year values. Dividends are the end of year values. To Do Create a spreadsheet and analyze the following market transactions a. Use the data that Laura has found on the three securities and calculate the holding period return for each year and the average return over a five-year period. b. Calculate the standard deviations of the returns for IBM, HP, and the S&P 500 Index c. What industries are associated with IBM and HP? d. Based on your answer in parte and your results for the average return and the standard deviation, what conchusions can Laura make about investing in either IBM or HP? 14 15 37 8 9 Solution a. Use the data that Laura has found on the three securities and calculate the holding period return for each year and the average return over a five-year period. Specifically, the HPR will be based upon five unique one-year periods (ie, 2012 to 2013, 2013 to 2014, 2014 to 2015, 2015 to 2016, and 2016 to 2017). Use the following formula HPR = [Inc +(K-VJV where Inc = income during period, V. = ending investment value, Vo = beginning investment value 4.25 E24 1 X ALA G M a. Use the data that Laura has found on the three securities and calculate the holcling period return for each year and the average return over a five-year period. Specifically, the HPR will be based upon five unique one-year periods (ie, 2012 to 2013, 2013 to 2014, 2014 to 2015, 2015 to 2016 and 2016 to 2017) Use the following formula HPR - [Inc +(v. V.), where Inc income during period, V. ending investment value, Vo = beginning investment value. The average rate of return could be interpreted as either the arithmetic average of the HPRs shown in the HPR row or the IRR of the following investment a share is bought at the end of 2011, dividends are received annually during the period 2012- 2016, the share is sold at the very end of 2016 (after 2016 dividends are received). Assume that the prices in the table above are given for the beginning of the year. 21 22 23 2011 2012 2013 2014 2015 2016 AVG HPR IRR 24 25 26 HPREN HPRC HPRAD Cash flows Cash flows 28 29 b. Calculate the standard deviations of the returns for IBM, HP, and the S&P 500 Index 30 31 Paste A-e = Merge Center - $ %) 98 Clipboard IM Font Conditional Format Formatting Table Styles Styles Ahgnment Number E24 M N 2A B 29 30 b. Calculate the standard deviations of the returns for IBM, HP, and the S&P 500 Index 31 32 (R. avg) 33 2012 2013 St. Dev. 2014 2015 2016 Year IBM HP S&P 335 37 38 c. What industries are associated with IBM and HP? 39 40 is an information technology company that creates both hardware and software for that industry, is an oilfield services corporation manufacturing and servicing equipment for energy exploration 41 d. Based on your answer in partc and your results for the average return and the standard deviation, what conclusions can Laura make about investing in either IBM or HP? 43 45 Based on the standard deviation. IBM is risky than HP. If looking at the returns over the five year period, then would have been the better investment 46 47 Points 49 Requirements Tonnett Lantlleth handen for 2010 4.25
