

Question
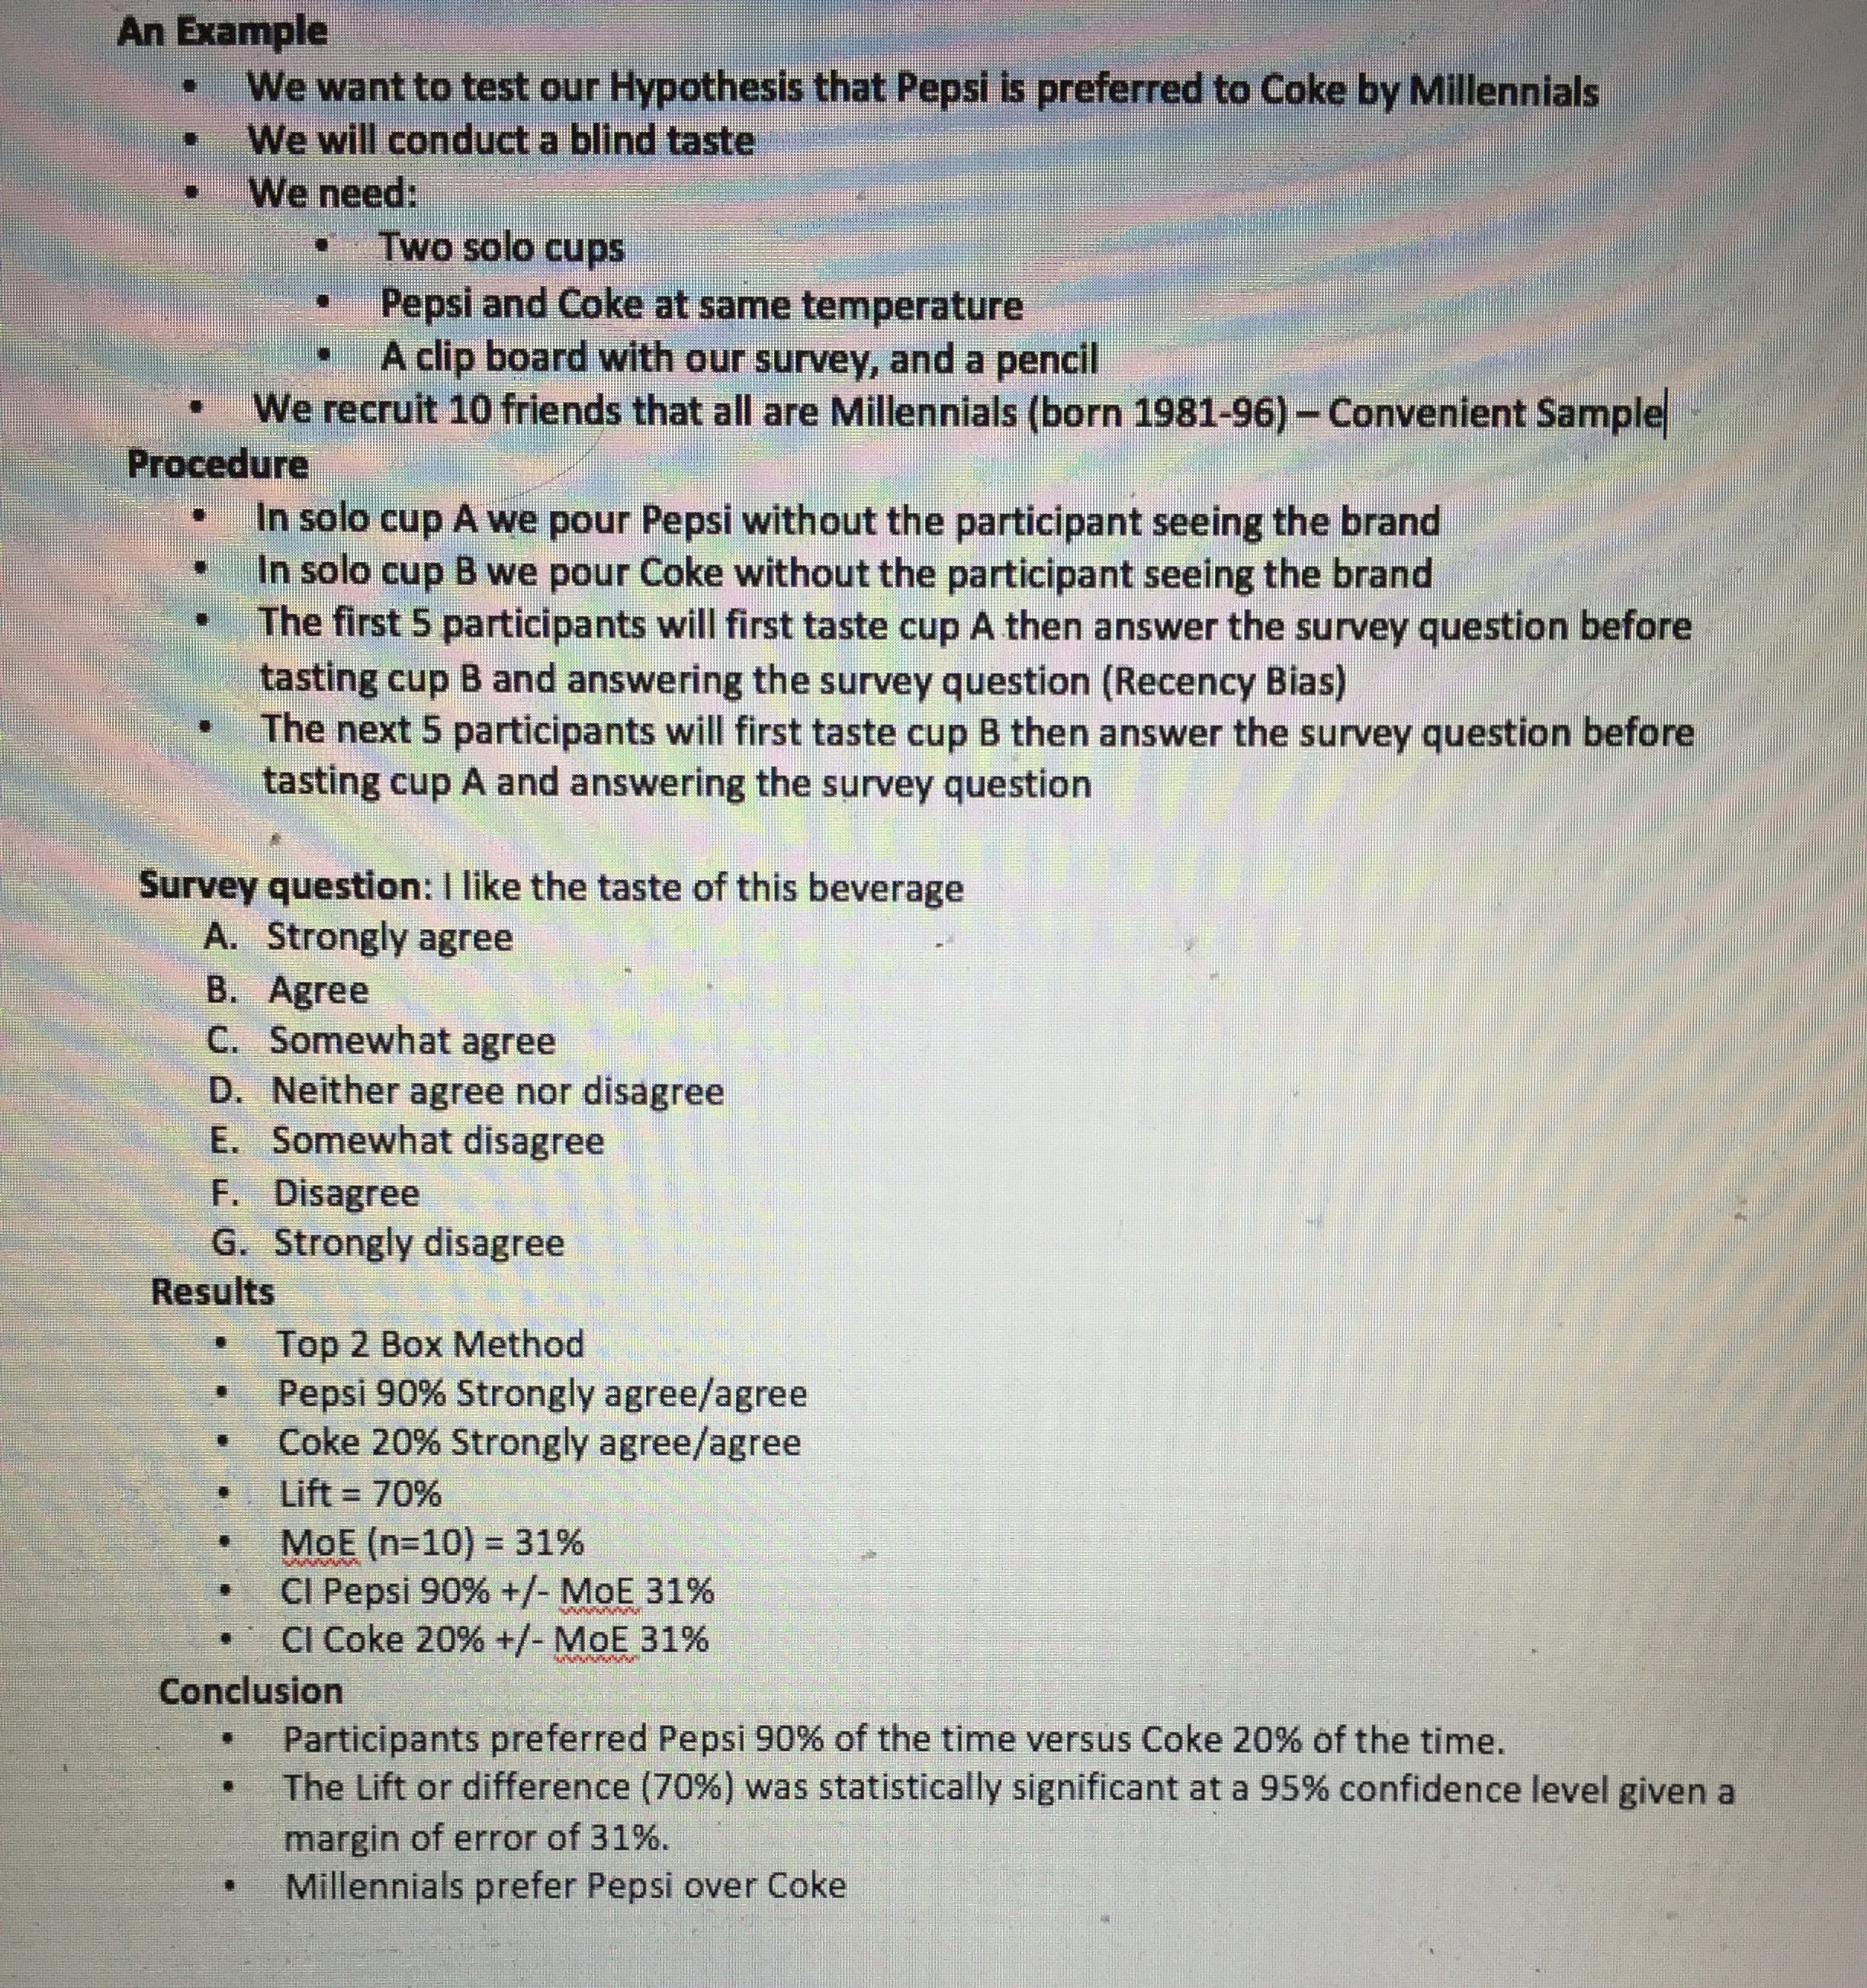
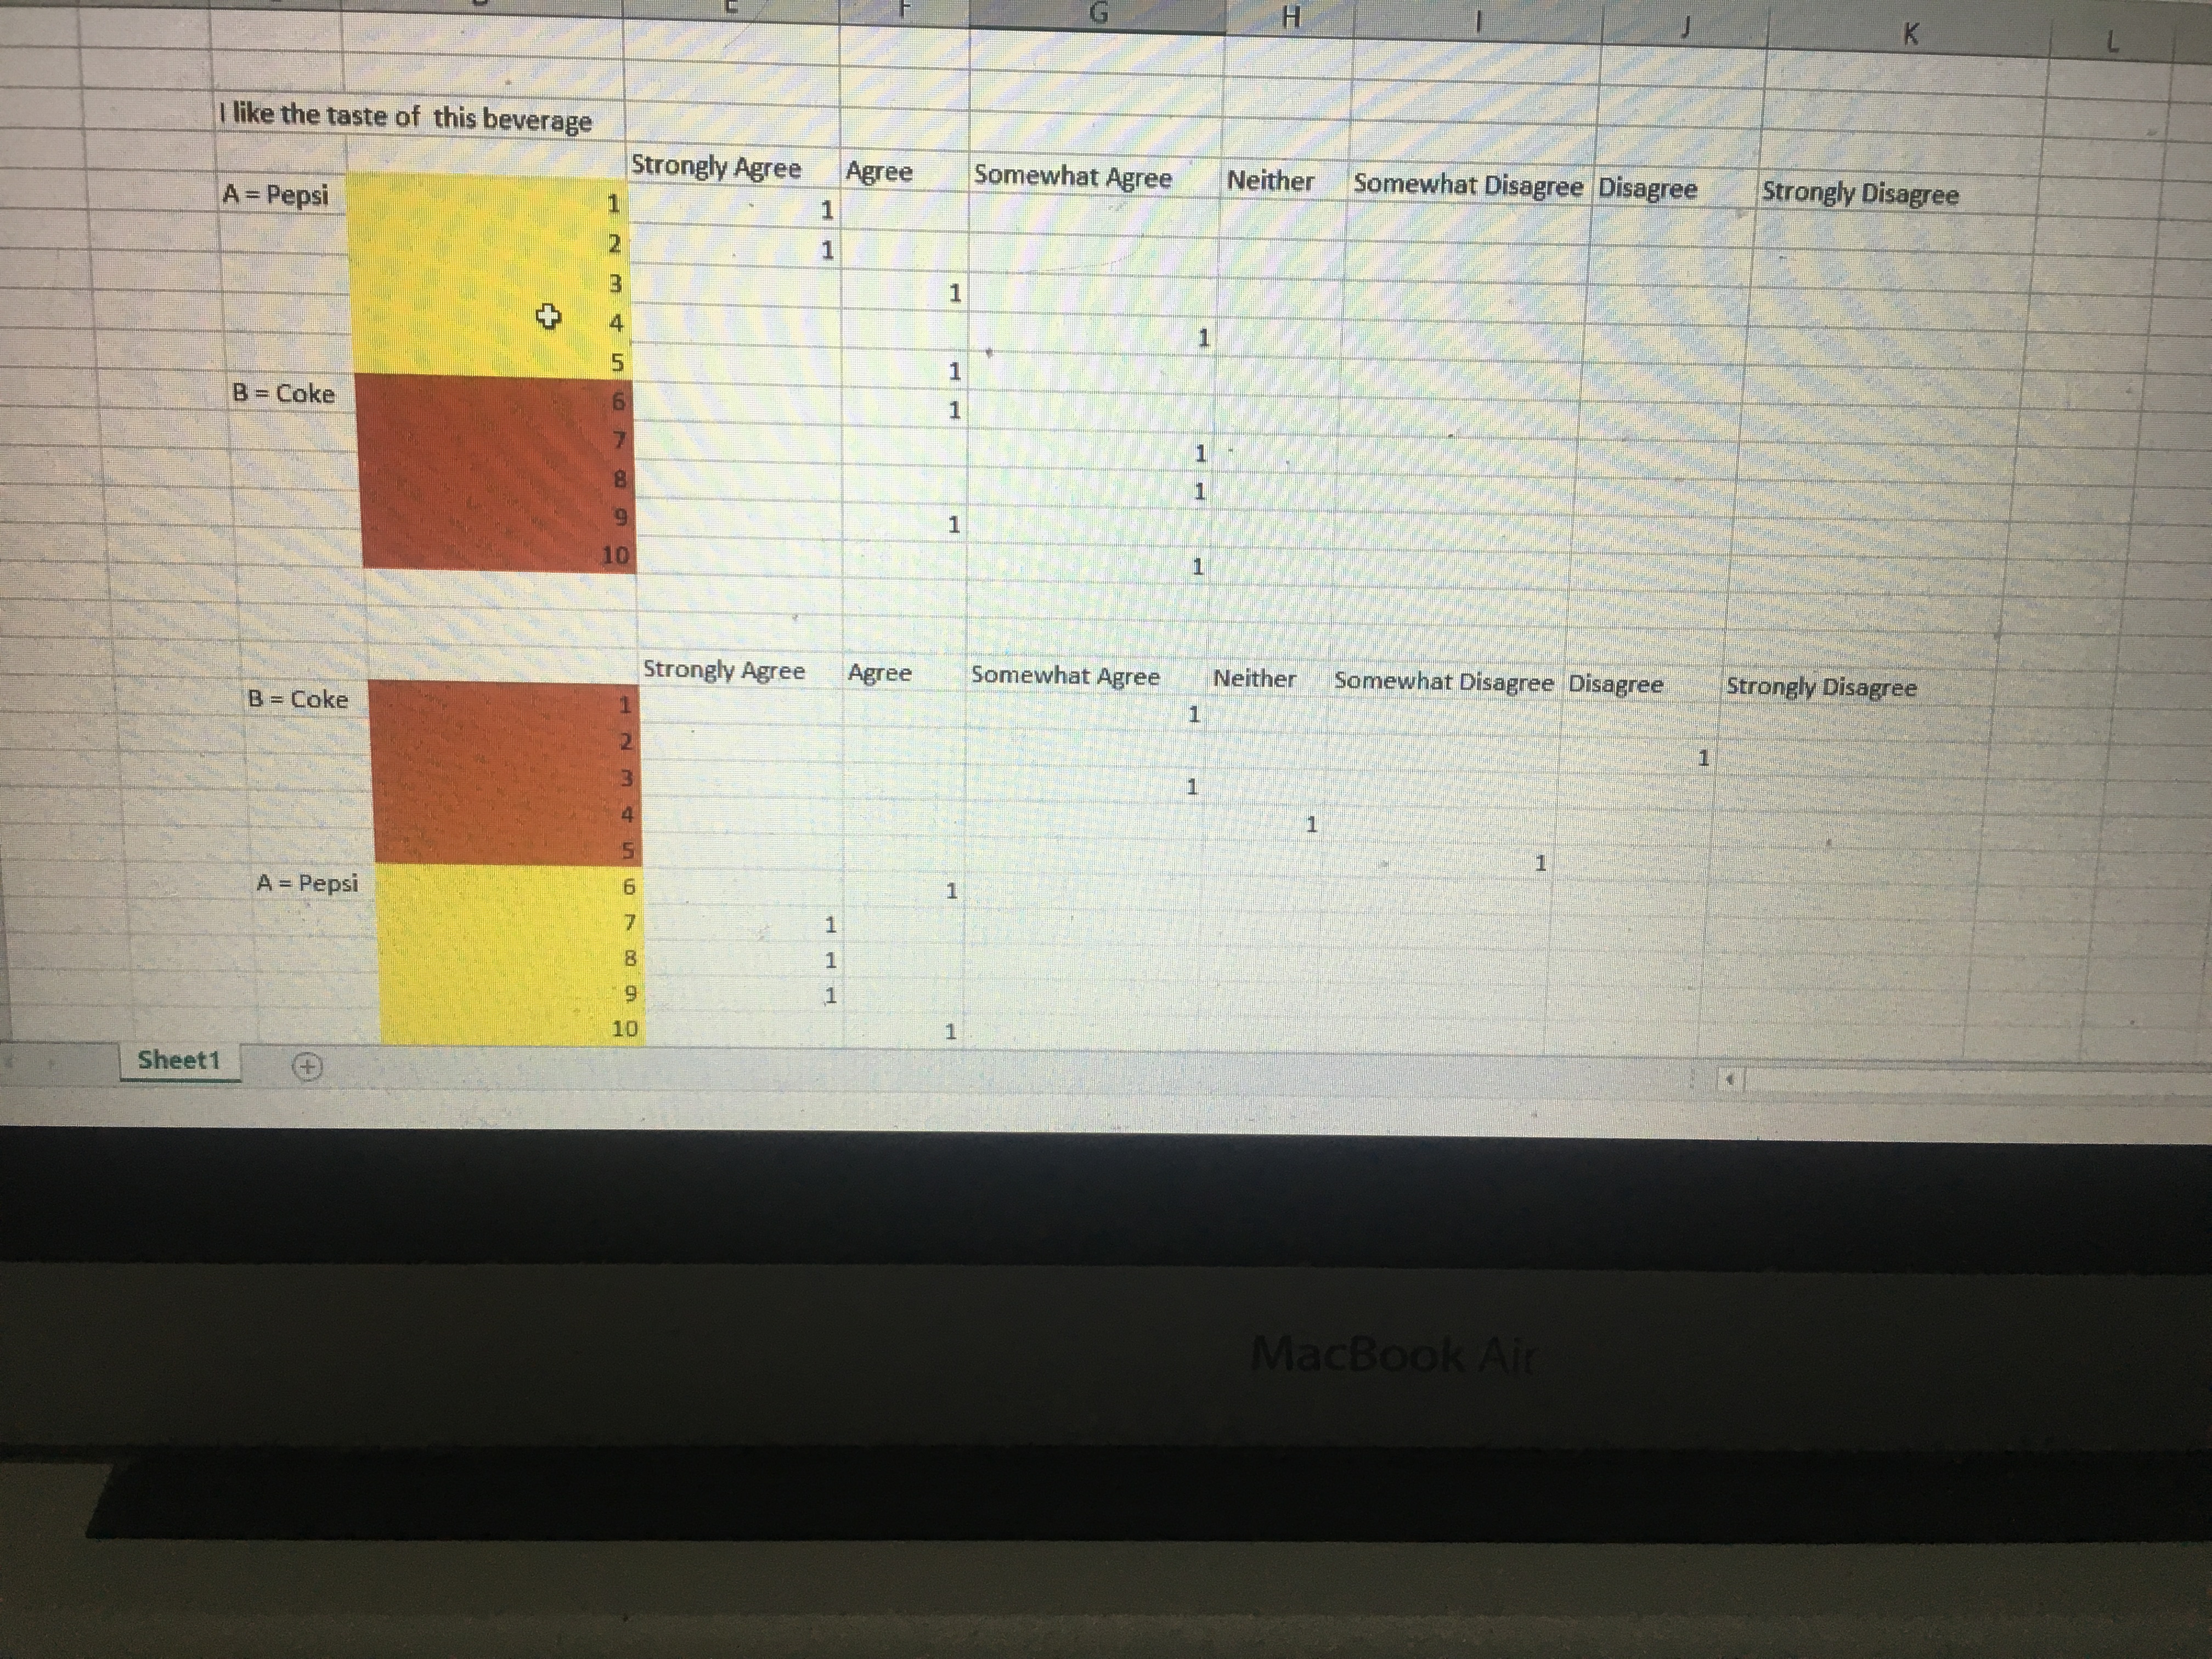
A/b Testing Build an experiment between two marketing stimuli and verify your hypothesis that one stimulus is better statistically than the other. Show your work.
A/b Testing
Build an experiment between two marketing stimuli and verify your hypothesis that one stimulus is better statistically than the other. Show your work. (Doesn't have to be real, It can be made up as long as you show your work)
Report describing the experiment and the results (incl. stat. test) along with your conclusion.
?EX: two different websites, two different Ads, two different CTA
Down below is an example , you can do the same experiment or choose a different one. if you shows to do Pepsi and Coke make sure your experiment is well describe and different (No bullet points). Must be a Convenient Sample 10 people.

Step by Step Solution
There are 3 Steps involved in it
Step: 1

Get Instant Access to Expert-Tailored Solutions
See step-by-step solutions with expert insights and AI powered tools for academic success
Step: 2

Step: 3
Ace Your Homework with AI
Get the answers you need in no time with our AI-driven, step-by-step assistance
Get Started
Foundations of Marketing
Authors: William M. Pride, O. C. Ferrell
3rd Edition
618973370, 547154569, 9780618973378, 978-0547154565