Acceleration of a falling object revisited graphing techniques and statistics. Question 5 Determine a value for g from the intercept of your log-log graph. Calculate
Acceleration of a falling object revisited graphing techniques and statistics.
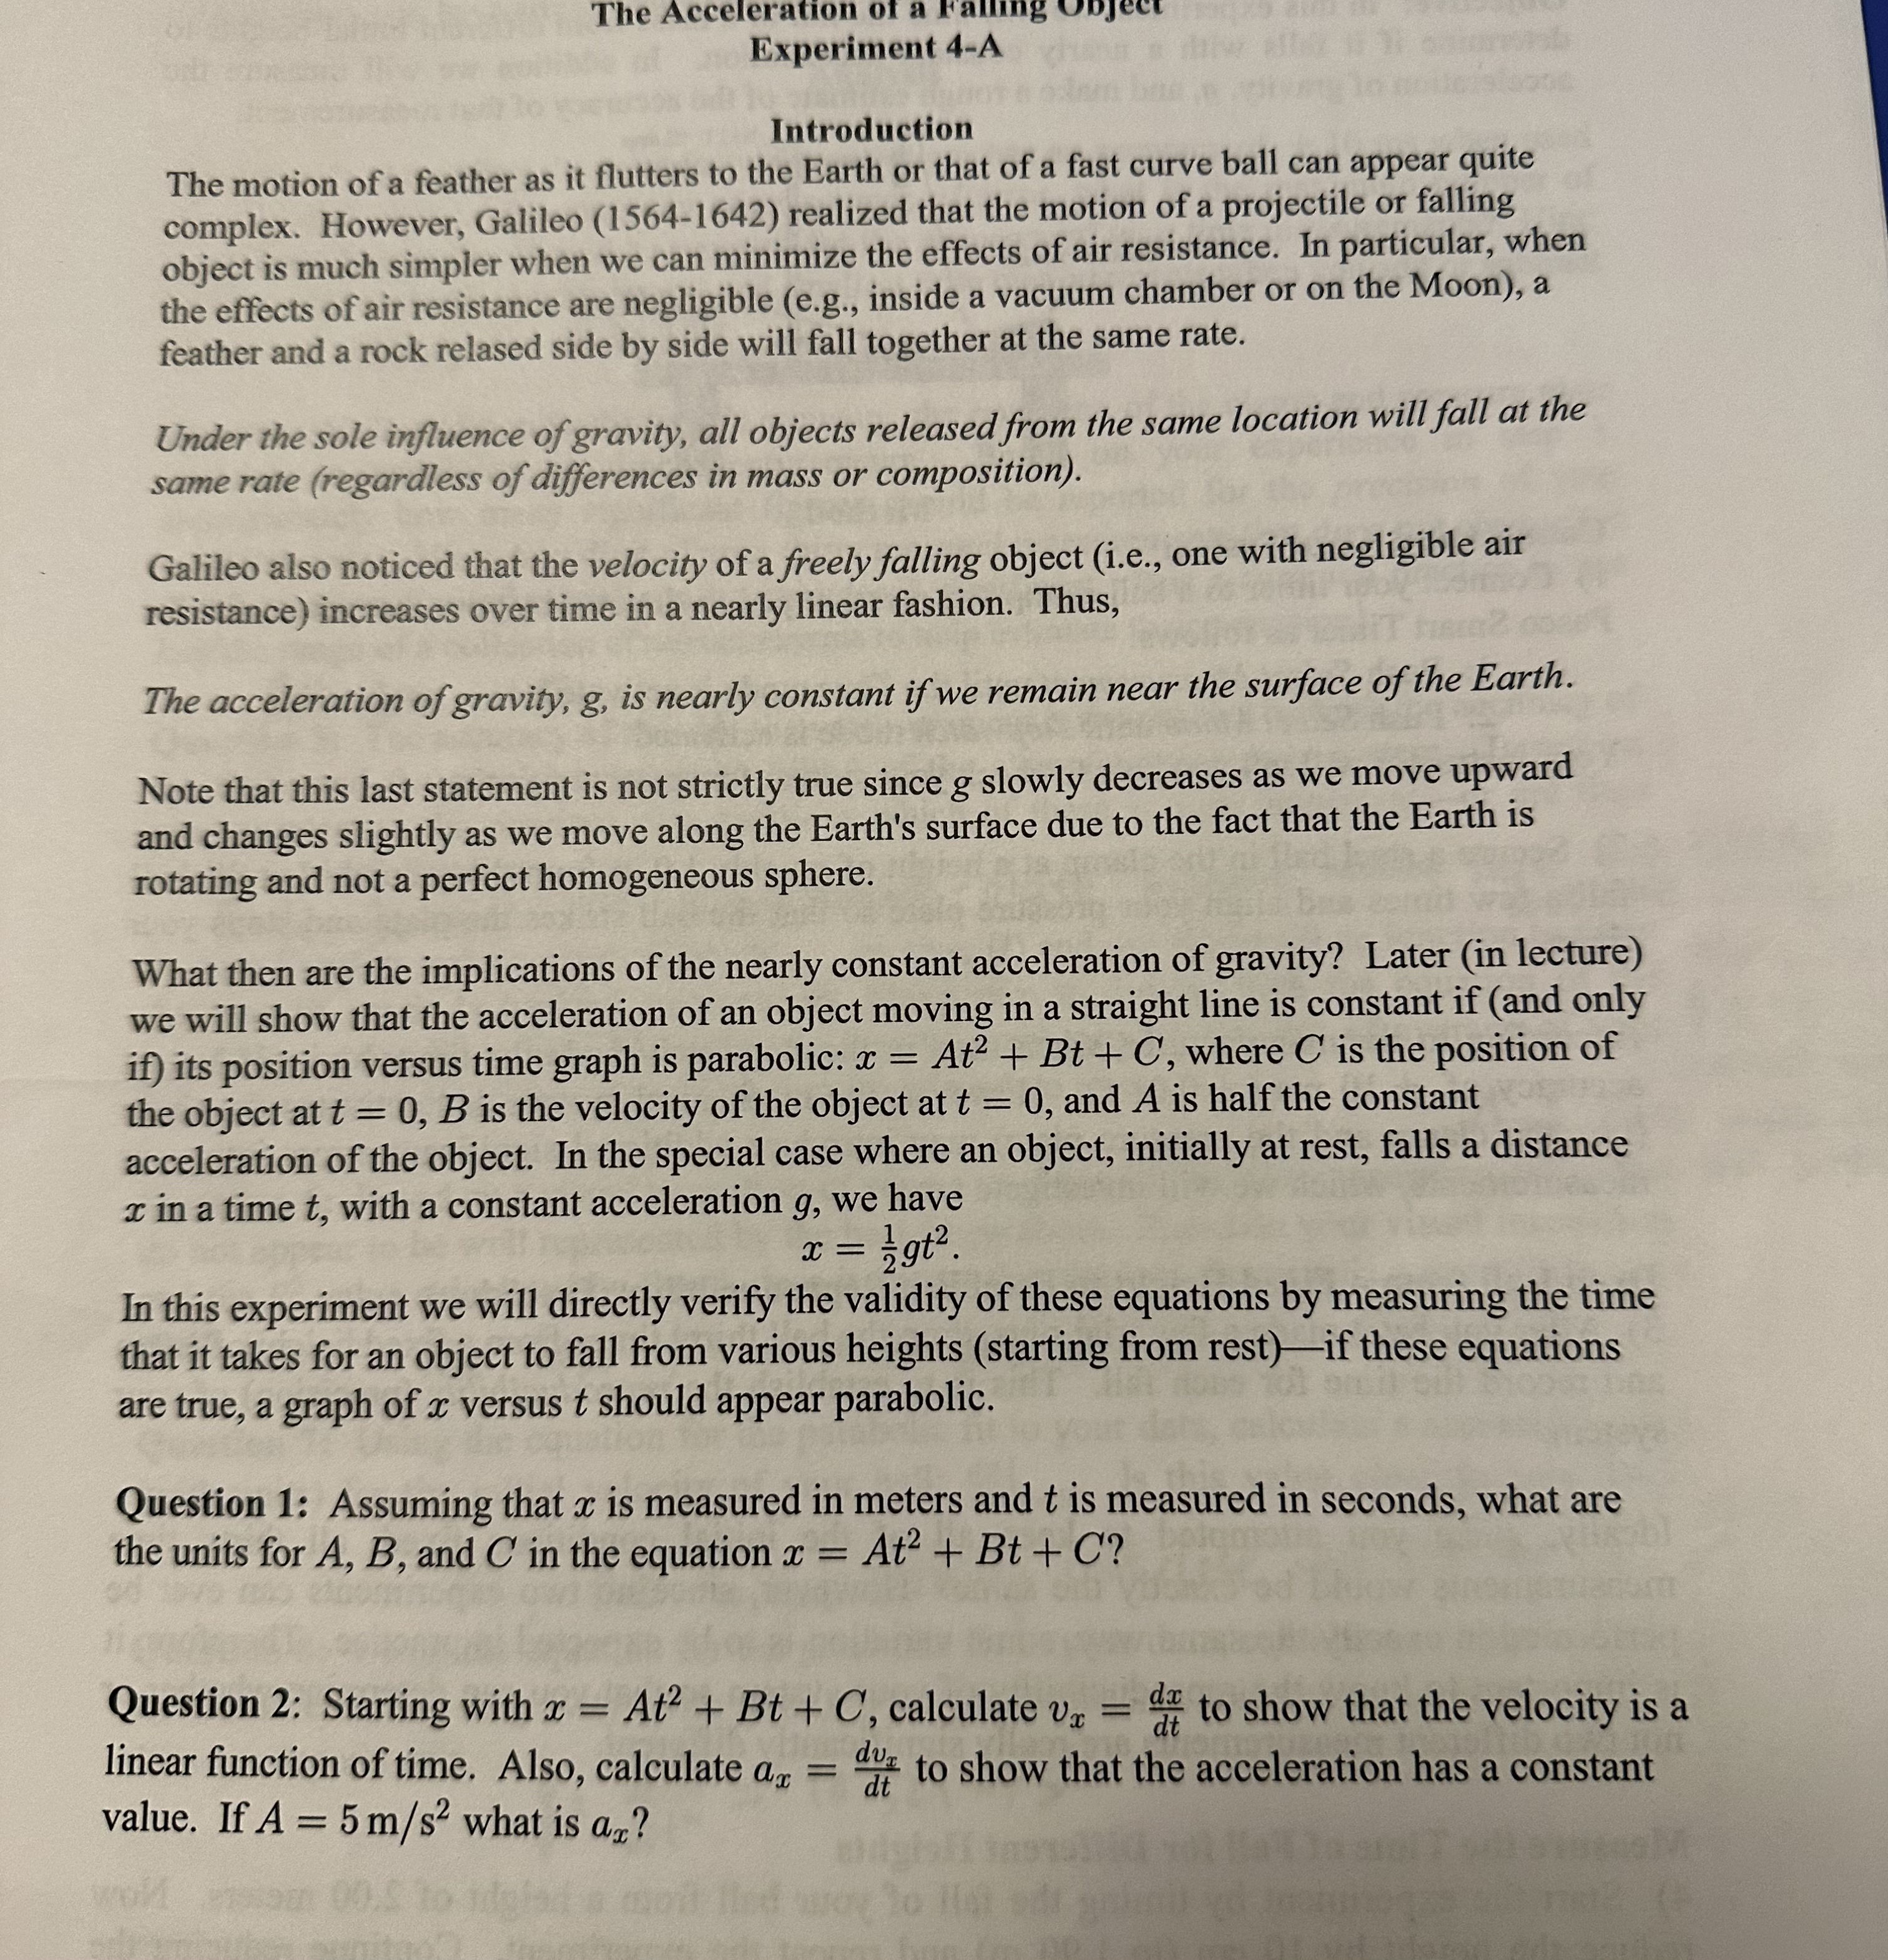
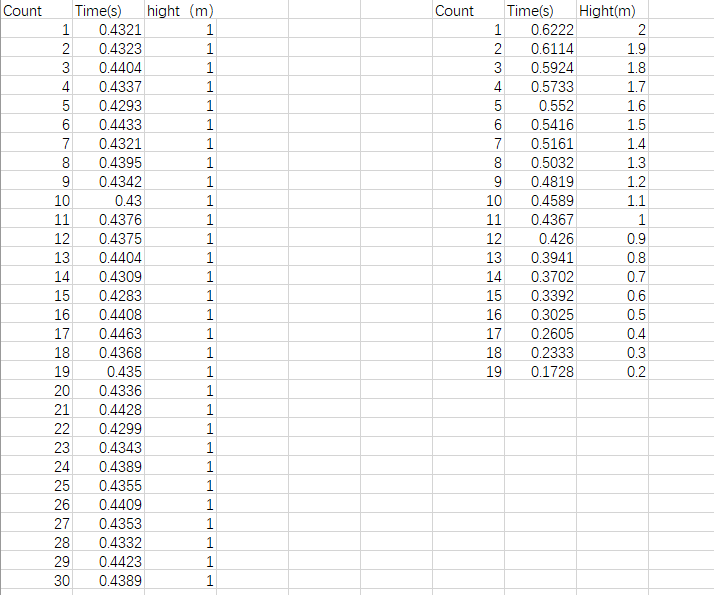
Question 5 Determine a value for g from the intercept of your log-log graph. Calculate the percent error for this value assuming the local value of g is 9.80 m/s2. Question 6 Determine the mean and precision (half the range) of your three g values. Question 7 As you can see the value that we get for g depends to some extent on the assumptions that we make and the way we analyze our data. Do all these values agree with the accepted value of 9.80 m/s2 to within two significant figures? Statistics Last week you estimated the precision of your 30 time measurements (which were made from a fixed height of 1.0 meter) by computing half their range. Although the range is often used as a simple estimate of variability, there is a more sophisticated measure known as the standard deviation. The standard deviation has two advantages over the range: It is determined by all of the data-not just the two extreme values It has a meaningful statistical interpretation. Here are the two relevant formulae range = high value - low value sample standard deviation = s = n-1 , where r; is the ith measured value of the n values of x and x is their mean value. Today we will simply learn how to use Excel to calculate a standard deviation (you will not need to use the formula given above). We will discuss the meaning of the standard deviation in a future experiment. 3. Enter your thirty time measurements (those made from a fixed height) into Excel. Calculate the mean time of fall (t ) and the sample standard deviation (At) of the 30 measuements. Your instructor will explain how to use Excel's built-in fucntions to do this. Question 8: What is the relative (percent) precision of your time measurements ( . 100%)? Does the At calculated by the statistics program roughly correspond to your previous estimate of the number of significant figures in your time measurements (explain)? Note that the precision of a measurement only measures how reproducible the measurements are-it does not establish the accuracy of the measurement. Final Lab Report For this experiment simply turn in a copy of your two graphs and your answers to the 8 questions.(4) The accuracy in the value you report for g is limited by four things: (a) the accuracy of the timer (addressed in Question 3) (b) the reproduciblety (precision) of the mechanical system (addressed in Question 4) (c) timing errors introduced by the finite travel of the pressure plate as it closes (d) uncertainties introduced by the curve-fit algorithm It is fairly difficult to take all of these things into account, so for now we will focus only on the accuracy of the timer. Question 9: Considering only the accuracy of your timer, report the value for g that you found in question 8 using the correct number of significant figures. Question 10: Assuming that g = 9.80 m/s2 is correct for our location, calculate the percent error in your measurement of g: Percent Error = Measured Value-Correct Value . 100% Does your measured value agree with the accepted value to the number of significant figures Correct Value that you reported in question 9? Lab Report Write a lab report and upload it into canvas by Friday. This report should contain the following: .summary/conclusion .answers to the ten questions .x vs. t graph (don't forget to give the graph a title and label its axes) Your summary/conclusion should provide a brief overview of your work and highlight its most significant conclusion(s). Your summary should be self contained-do not assume that I have read your answers to the ten questions (even though I will)! In particular, your summary should discuss whether your experiment supports the claim that your mass falls with a nearly constant acceleration (make sure that you refer to your data and graph to support your claim). Also, report your best estimate for the value of g - pay careful attention to significant figures.\f\f\f\f\f
Step by Step Solution
There are 3 Steps involved in it
Step: 1
Get Instant Access to Expert-Tailored Solutions
See step-by-step solutions with expert insights and AI powered tools for academic success
Step: 2
Step: 3
Ace Your Homework with AI
Get the answers you need in no time with our AI-driven, step-by-step assistance