Answered step by step
Verified Expert Solution
Link Copied!

Question

1 Approved Answer

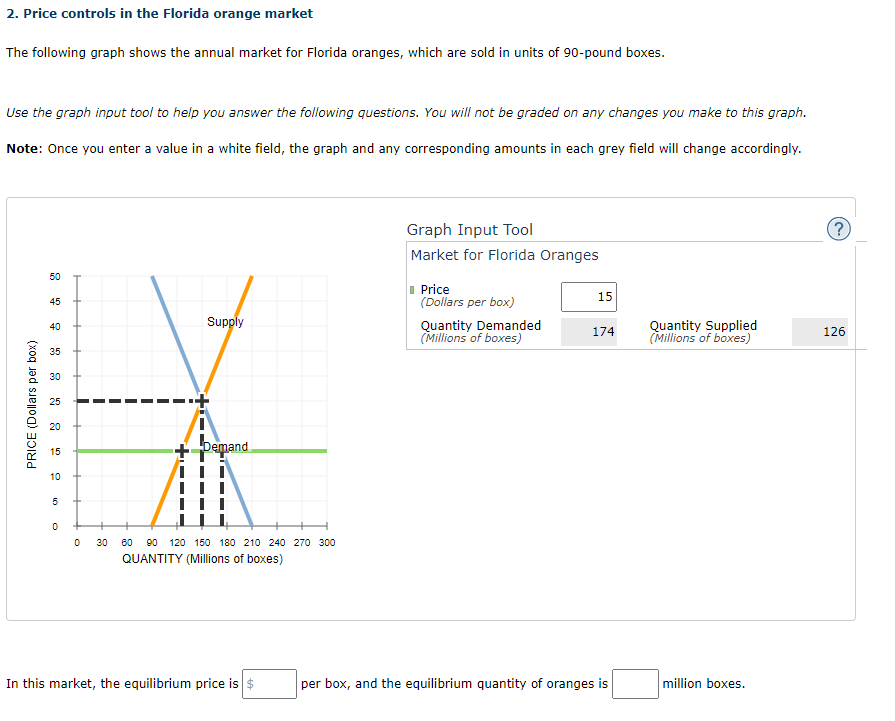
The question I need an answer to is in the image attached. 2. Price controls in the Florida orange market The following graph shows the

The question I need an answer to is in the image attached.

image text in transcribed
2. Price controls in the Florida orange market The following graph shows the annual market for Florida oranges, which are sold in units of 90-pound boxes. Use the graph input tool to help you answer the following questions. You will not be graded on any changes you make to this graph. Note: Once you enter a value in a white field, the graph and any corresponding amounts in each grey field will change accordingly. Graph Input Tool Market for Florida Oranges 50 Price 45 ( Dollars per box) 15 Supply Quantity Demanded 174 Quantity Supplied PRICE (Dollars per box) (Millions of boxes) (Millions of boxes) 126 35 30 20 Demand 0 30 60 90 120 150 180 210 240 270 300 QUANTITY (Millions of boxes) In this market, the equilibrium price is $ per box, and the equilibrium quantity of oranges is million boxes

Step by Step Solution

There are 3 Steps involved in it

Step: 1

blur-text-image

Get Instant Access to Expert-Tailored Solutions

See step-by-step solutions with expert insights and AI powered tools for academic success

Step: 2

blur-text-image

Step: 3

blur-text-image

Ace Your Homework with AI

Get the answers you need in no time with our AI-driven, step-by-step assistance

Get Started

Recommended Textbook for

Managerial economics

Authors: william f. samuelson stephen g. marks

7th edition

9781118214183, 1118041585, 1118214188, 978-1118041581

More Books

Students also viewed these Economics questions

Question

=+1. How is economics like a science?

Answered: 1 week ago

Question

LO3.1 Characterize and give examples of markets.

Answered: 1 week ago