

Answered step by step
Verified Expert Solution
Question
1 Approved Answer
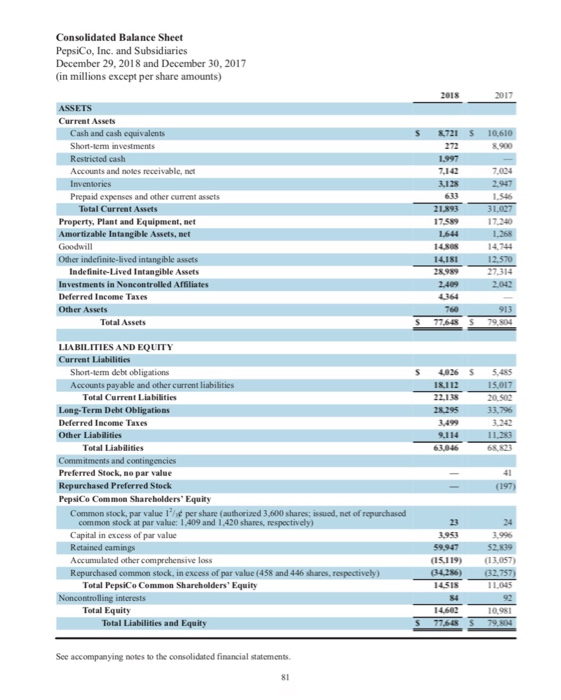
According to the annual report of PepsiCo., calculate the inventory turnover for 2018 and 2017, show calculations. In addition, determine which year did better. Annual
According to the annual report of PepsiCo., calculate the inventory turnover for 2018 and 2017, show calculations. In addition, determine which year did better. 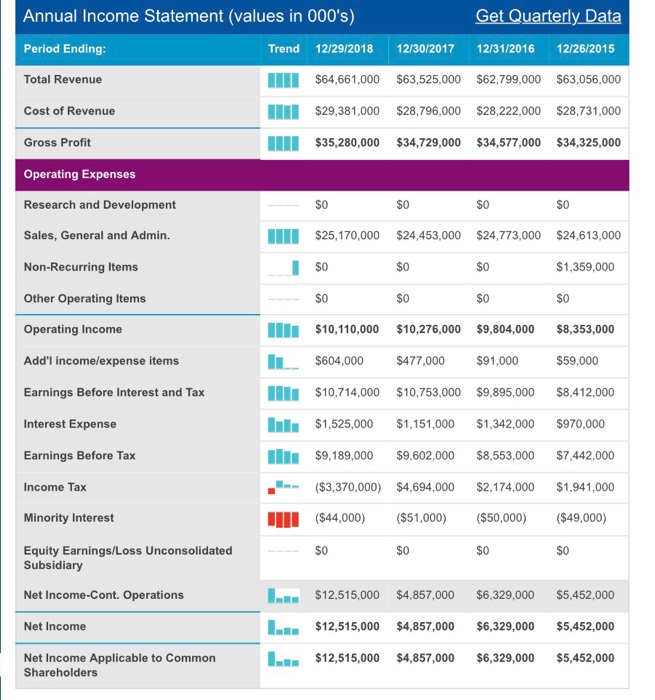
Annual Income Statement (values in 000's) Period Ending Total Revenue Get Quarterly Data Trend 12/29/2018 12/30/2017 12/31/2016 12/26/2015 $64,661,000 $63,525,000 $62,799,000 $63,056,000 $29,381,000 $28,796,000 $28,222,000 $28,731,000 $35,280,000 $34,729,000 $34,577,000 $34,325,000 Cost of Revenue Gross Profit Operating Expenses Research and Development Sales, General and Admin. Non-Recurring Items Other Operating Items Operating Income Add'l income/expense items Earnings Before Interest and Tax Interest Expense Earnings Before Tax Income Tax Minority Interest Equity Earnings/Loss Unconsolidated S0 $0 S0 S0 $25,170,000 $24,453,000 $24,773,000 $24,613,000 $1,359,000 $0 SO I$10,110,000 $10,276,000 $9,804,000 $8,353,000 $604,000 $477,000 $91,000 $59,000 $10,714,000 $10,753,000 $9,895,000 $8,412,000 $1,525,000 $1,151,000 $1,342,000 $970,000 $9,189,000 $9,602,000 $8,553,000 $7,442,000 ($3,370,000 $4,694,000 $2,174,000 $1,941,000 ($44,000) ($51,000 ($50,000) ($49,000) S0 $0 $0 S0 Subsidiary Net Income-Cont. Operations Net Income $12,515,000 $4,857,000 $6,329,000 $5,452,000 $12,515,000 $4,857,000 $6,329,000 $5,452,000 l.Nm $12,515,000 $4,857,000 $6,329,000 $5,452,000 Net Income Applicable to Common Shareholders Step by Step Solution
There are 3 Steps involved in it
Step: 1

Get Instant Access to Expert-Tailored Solutions
See step-by-step solutions with expert insights and AI powered tools for academic success
Step: 2

Step: 3
Ace Your Homework with AI
Get the answers you need in no time with our AI-driven, step-by-step assistance
Get Started
Elements Of Cost And Management Accounting
Authors: Gautam Kumar Jana
1st Edition
1642874884, 9781642874884