

Answered step by step
Verified Expert Solution
Question
1 Approved Answer
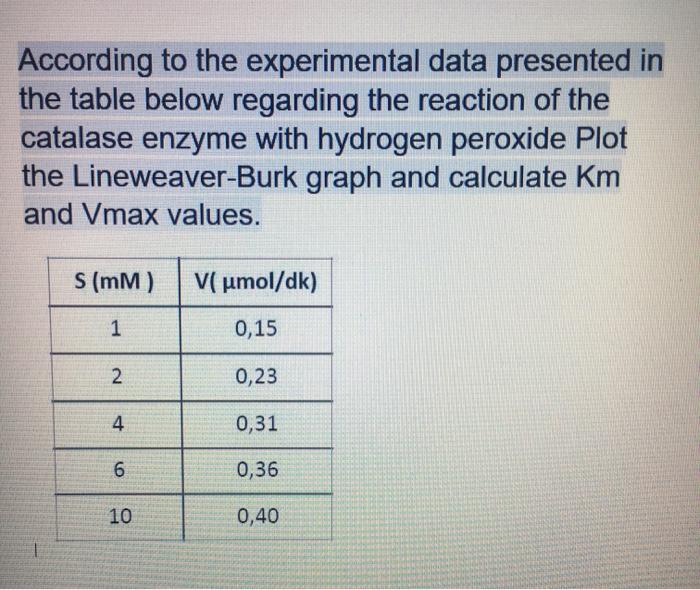
According to the experimental data presented in the table below regarding the reaction of the catalase enzyme with hydrogen peroxide Plot the Lineweaver-Burk graph and
Step by Step Solution
There are 3 Steps involved in it
Step: 1

Get Instant Access to Expert-Tailored Solutions
See step-by-step solutions with expert insights and AI powered tools for academic success
Step: 2

Step: 3
Ace Your Homework with AI
Get the answers you need in no time with our AI-driven, step-by-step assistance
Get Started
General Chemistry
Authors: John E. McMurry, Robert C. Fay
2nd Edition
1269962175, 978-1269962179