Answered step by step
Verified Expert Solution
Question
1 Approved Answer
The 2016 United Nations Climate Change Conference met in Morocco in order to agree on policies to reduce climate-warming pollution like carbon dioxide. Suppose


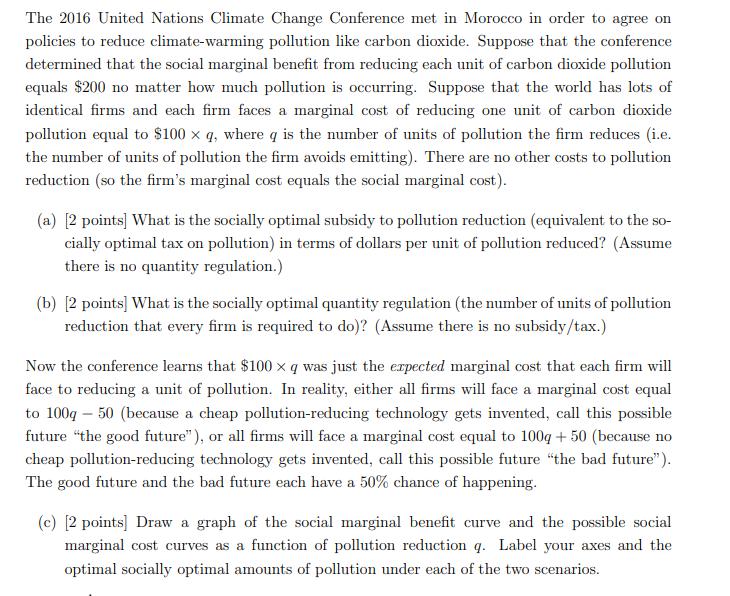
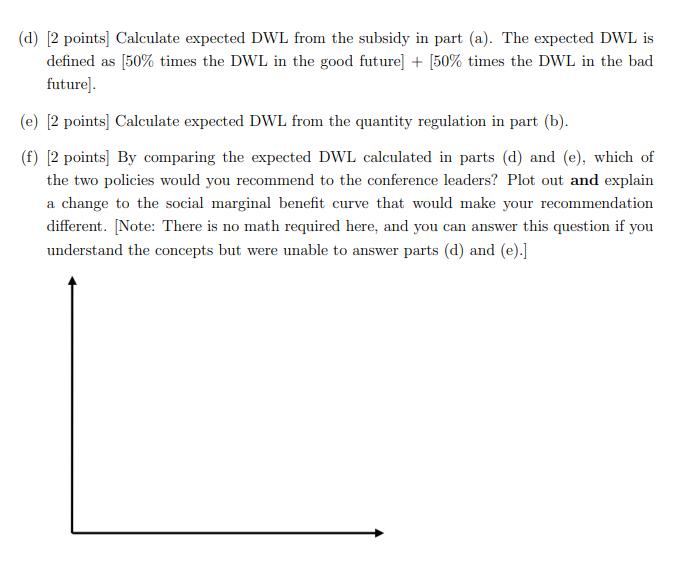
The 2016 United Nations Climate Change Conference met in Morocco in order to agree on policies to reduce climate-warming pollution like carbon dioxide. Suppose that the conference determined that the social marginal benefit from reducing each unit of carbon dioxide pollution equals $200 no matter how much pollution is occurring. Suppose that the world has lots of identical firms and each firm faces a marginal cost of reducing one unit of carbon dioxide pollution equal to $100 x q, where q is the number of units of pollution the firm reduces (i.e. the number of units of pollution the firm avoids emitting). There are no other costs to pollution reduction (so the firm's marginal cost equals the social marginal cost). (a) [2 points] What is the socially optimal subsidy to pollution reduction (equivalent to the so- cially optimal tax on pollution) in terms of dollars per unit of pollution reduced? (Assume there is no quantity regulation.) (b) [2 points] What is the socially optimal quantity regulation (the number of units of pollution reduction that every firm is required to do)? (Assume there is no subsidy/tax.) Now the conference learns that $100 x q was just the erpected marginal cost that each firm will face to reducing a unit of pollution. In reality, either all firms will face a marginal cost equal to 100q 50 (because a cheap pollution-reducing technology gets invented, call this possible future "the good future"), or all firms will face a marginal cost equal to 100q + 50 (because no cheap pollution-reducing technology gets invented, call this possible future "the bad future"). The good future and the bad future each have a 50% chance of happening. (c) [2 points] Draw a graph of the social marginal benefit curve and the possible social marginal cost curves as a function of pollution reduction q. Label your axes and the optimal socially optimal amounts of pollution under each of the two scenarios. (d) [2 points] Calculate expected DWL from the subsidy in part (a). The expected DWL is defined as [50% times the DWL in the good future] + [50% times the DWL in the bad future]. (e) 2 points] Calculate expected DWL from the quantity regulation in part (b). (f) [2 points] By comparing the expected DWL calculated in parts (d) and (e), which of the two policies would you recommend to the conference leaders? Plot out and explain a change to the social marginal benefit curve that would make your recommendation different. [Note: There is no math required here, and you can answer this question if you understand the concepts but were unable to answer parts (d) and (e).]
Step by Step Solution
★★★★★
3.44 Rating (163 Votes )
There are 3 Steps involved in it
Step: 1
a The socially optimal subsidy to pollution equals the social margi...
Get Instant Access to Expert-Tailored Solutions
See step-by-step solutions with expert insights and AI powered tools for academic success
Step: 2

Step: 3

Ace Your Homework with AI
Get the answers you need in no time with our AI-driven, step-by-step assistance
Get Started


