Answered step by step
Verified Expert Solution
Question
1 Approved Answer
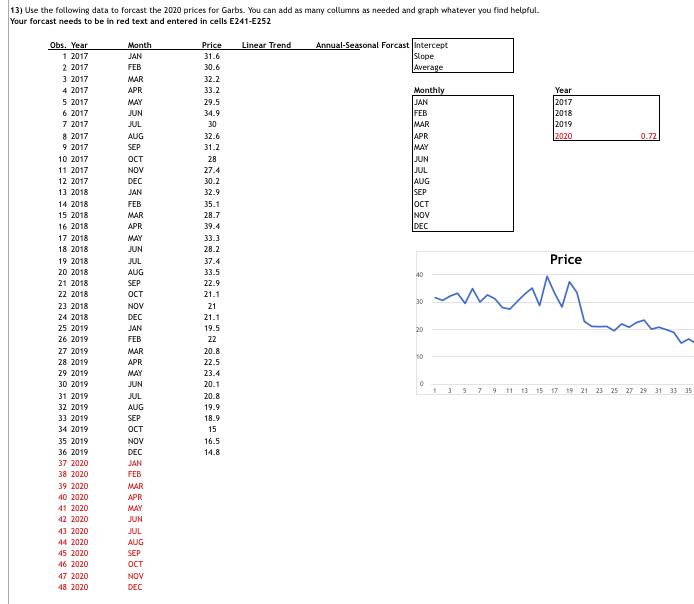
13) Use the following data to forcast the 2020 prices for Garbs. You can add as many collumns as needed and graph whatever you

13) Use the following data to forcast the 2020 prices for Garbs. You can add as many collumns as needed and graph whatever you find helpful. Your forcast needs to be in red text and entered in cells E241-E252 Obs. Year 1 2017 2 2017 3 2017 4 2017 5 2017 6 2017 7 2017 8 2017 9 2017 Annual-Seasonal Forcast Intercept Slope Average Month Linear Trend Price 31.6 JAN FEB 30.6 MAR 32.2 APR 33.2 Monthly JAN FEB MAR Year 2017 2018 2019 MAY 29.5 JUN 34.9 JUL 30 APR MAY 2020 AUG 32.6 0.72 SEP 31.2 JUN JUL AUG SEP OCT NOV DEC 10 2017 28 11 2017 NOV 27.4 12 2017 DEC 30.2 13 2018 JAN 32.9 14 2018 FEB 35.1 15 2018 MAR 28.7 16 2018 APR 39.4 17 2018 MAY 33.3 18 2018 JUN 28.2 19 2018 JUL 37.4 Price 20 2018 AUG 33.5 40 21 2018 SEP 22.9 22 2018 21.1 30 23 2018 NOV 21 24 2018 DEC 21.1 25 2019 JAN 19.5 20 26 2019 FEB 22 27 2019 MAR 20.8 28 2019 APR 22.5 29 2019 MAY 23.4 30 2019 JUN 20.1 11 13 15 17 19 21 23 25 27 29 1 33 35 31 2019 JUL 20.8 32 2019 AUG 19.9 33 2019 SEP 18.9 34 2019 15 35 2019 NOV 16.5 36 2019 DEC 14.8 37 2020 38 2020 JAN FEB 39 2020 MAR 40 2020 APR 41 2020 MAY 42 2020 JUN 43 2020 JUL 44 2020 AUG 45 2020 SEP 46 2020 47 2020 NOV 48 2020 DEC
Step by Step Solution
★★★★★
3.38 Rating (157 Votes )
There are 3 Steps involved in it
Step: 1
To forecast the 2020 prices for Garbs using the given data we can use a linear regression model to d...
Get Instant Access to Expert-Tailored Solutions
See step-by-step solutions with expert insights and AI powered tools for academic success
Step: 2

Step: 3

Ace Your Homework with AI
Get the answers you need in no time with our AI-driven, step-by-step assistance
Get Started


