Answered step by step
Verified Expert Solution
Question
1 Approved Answer
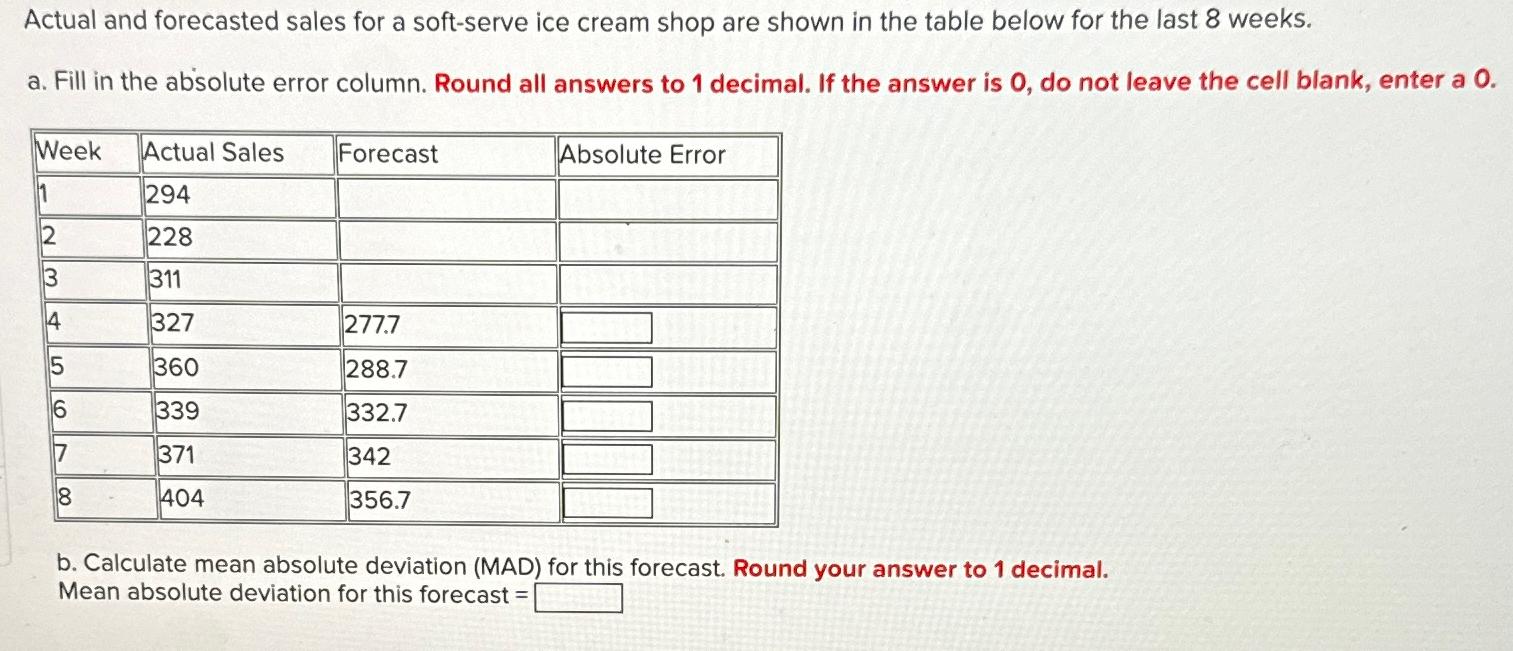
Actual and forecasted sales for a soft - serve ice cream shop are shown in the table below for the last 8 weeks. a .
Actual and forecasted sales for a softserve ice cream shop are shown in the table below for the last weeks.
a Fill in the absolute error column. Round all answers to decimal. If the answer is do not leave the cell blank, enter a
tableWeekActual Sales,Forecast,Absolute Error
b Calculate mean absolute deviation MAD for this forecast. Round your answer to decimal.
Mean absolute deviation for this forecast

Step by Step Solution
There are 3 Steps involved in it
Step: 1

Get Instant Access to Expert-Tailored Solutions
See step-by-step solutions with expert insights and AI powered tools for academic success
Step: 2

Step: 3

Ace Your Homework with AI
Get the answers you need in no time with our AI-driven, step-by-step assistance
Get Started


