Answered step by step
Verified Expert Solution
Question
1 Approved Answer
Additional Information needed for Question 2: Pepsi Total assets 2018 = 77,648 Pepsi LT debt 2018 = 28,295 Current Attempt in Progress The financial statement
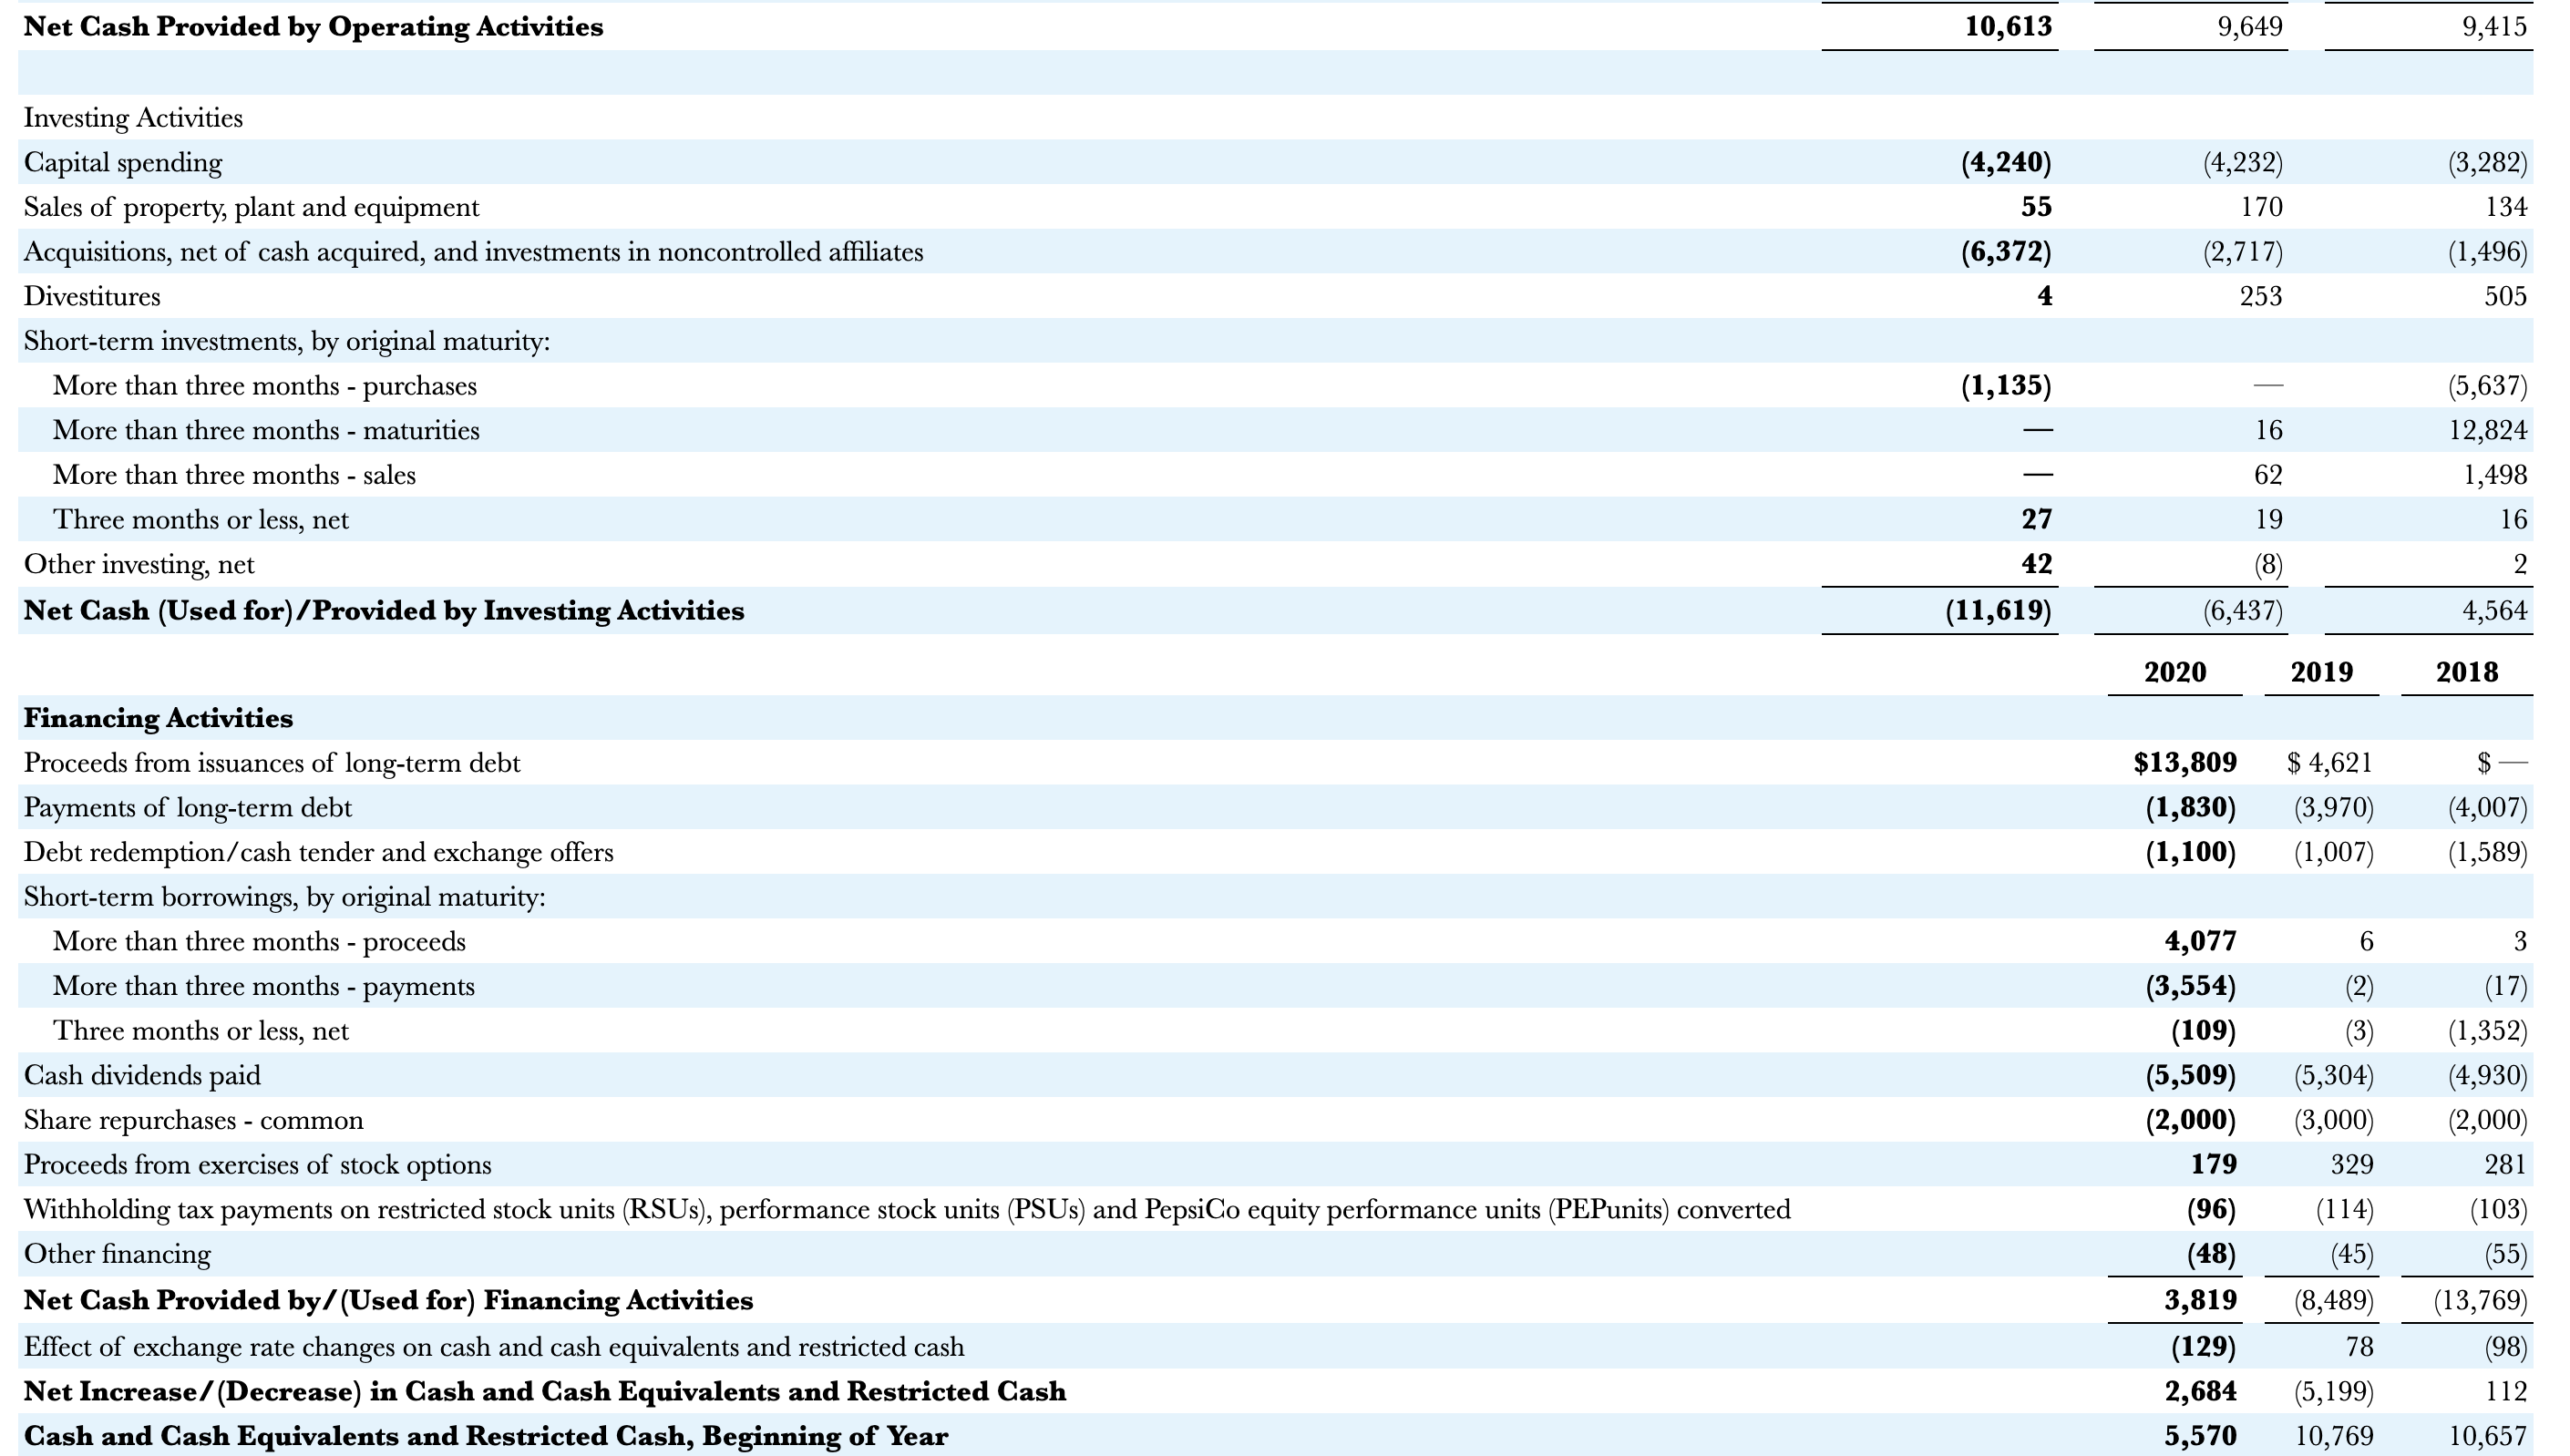
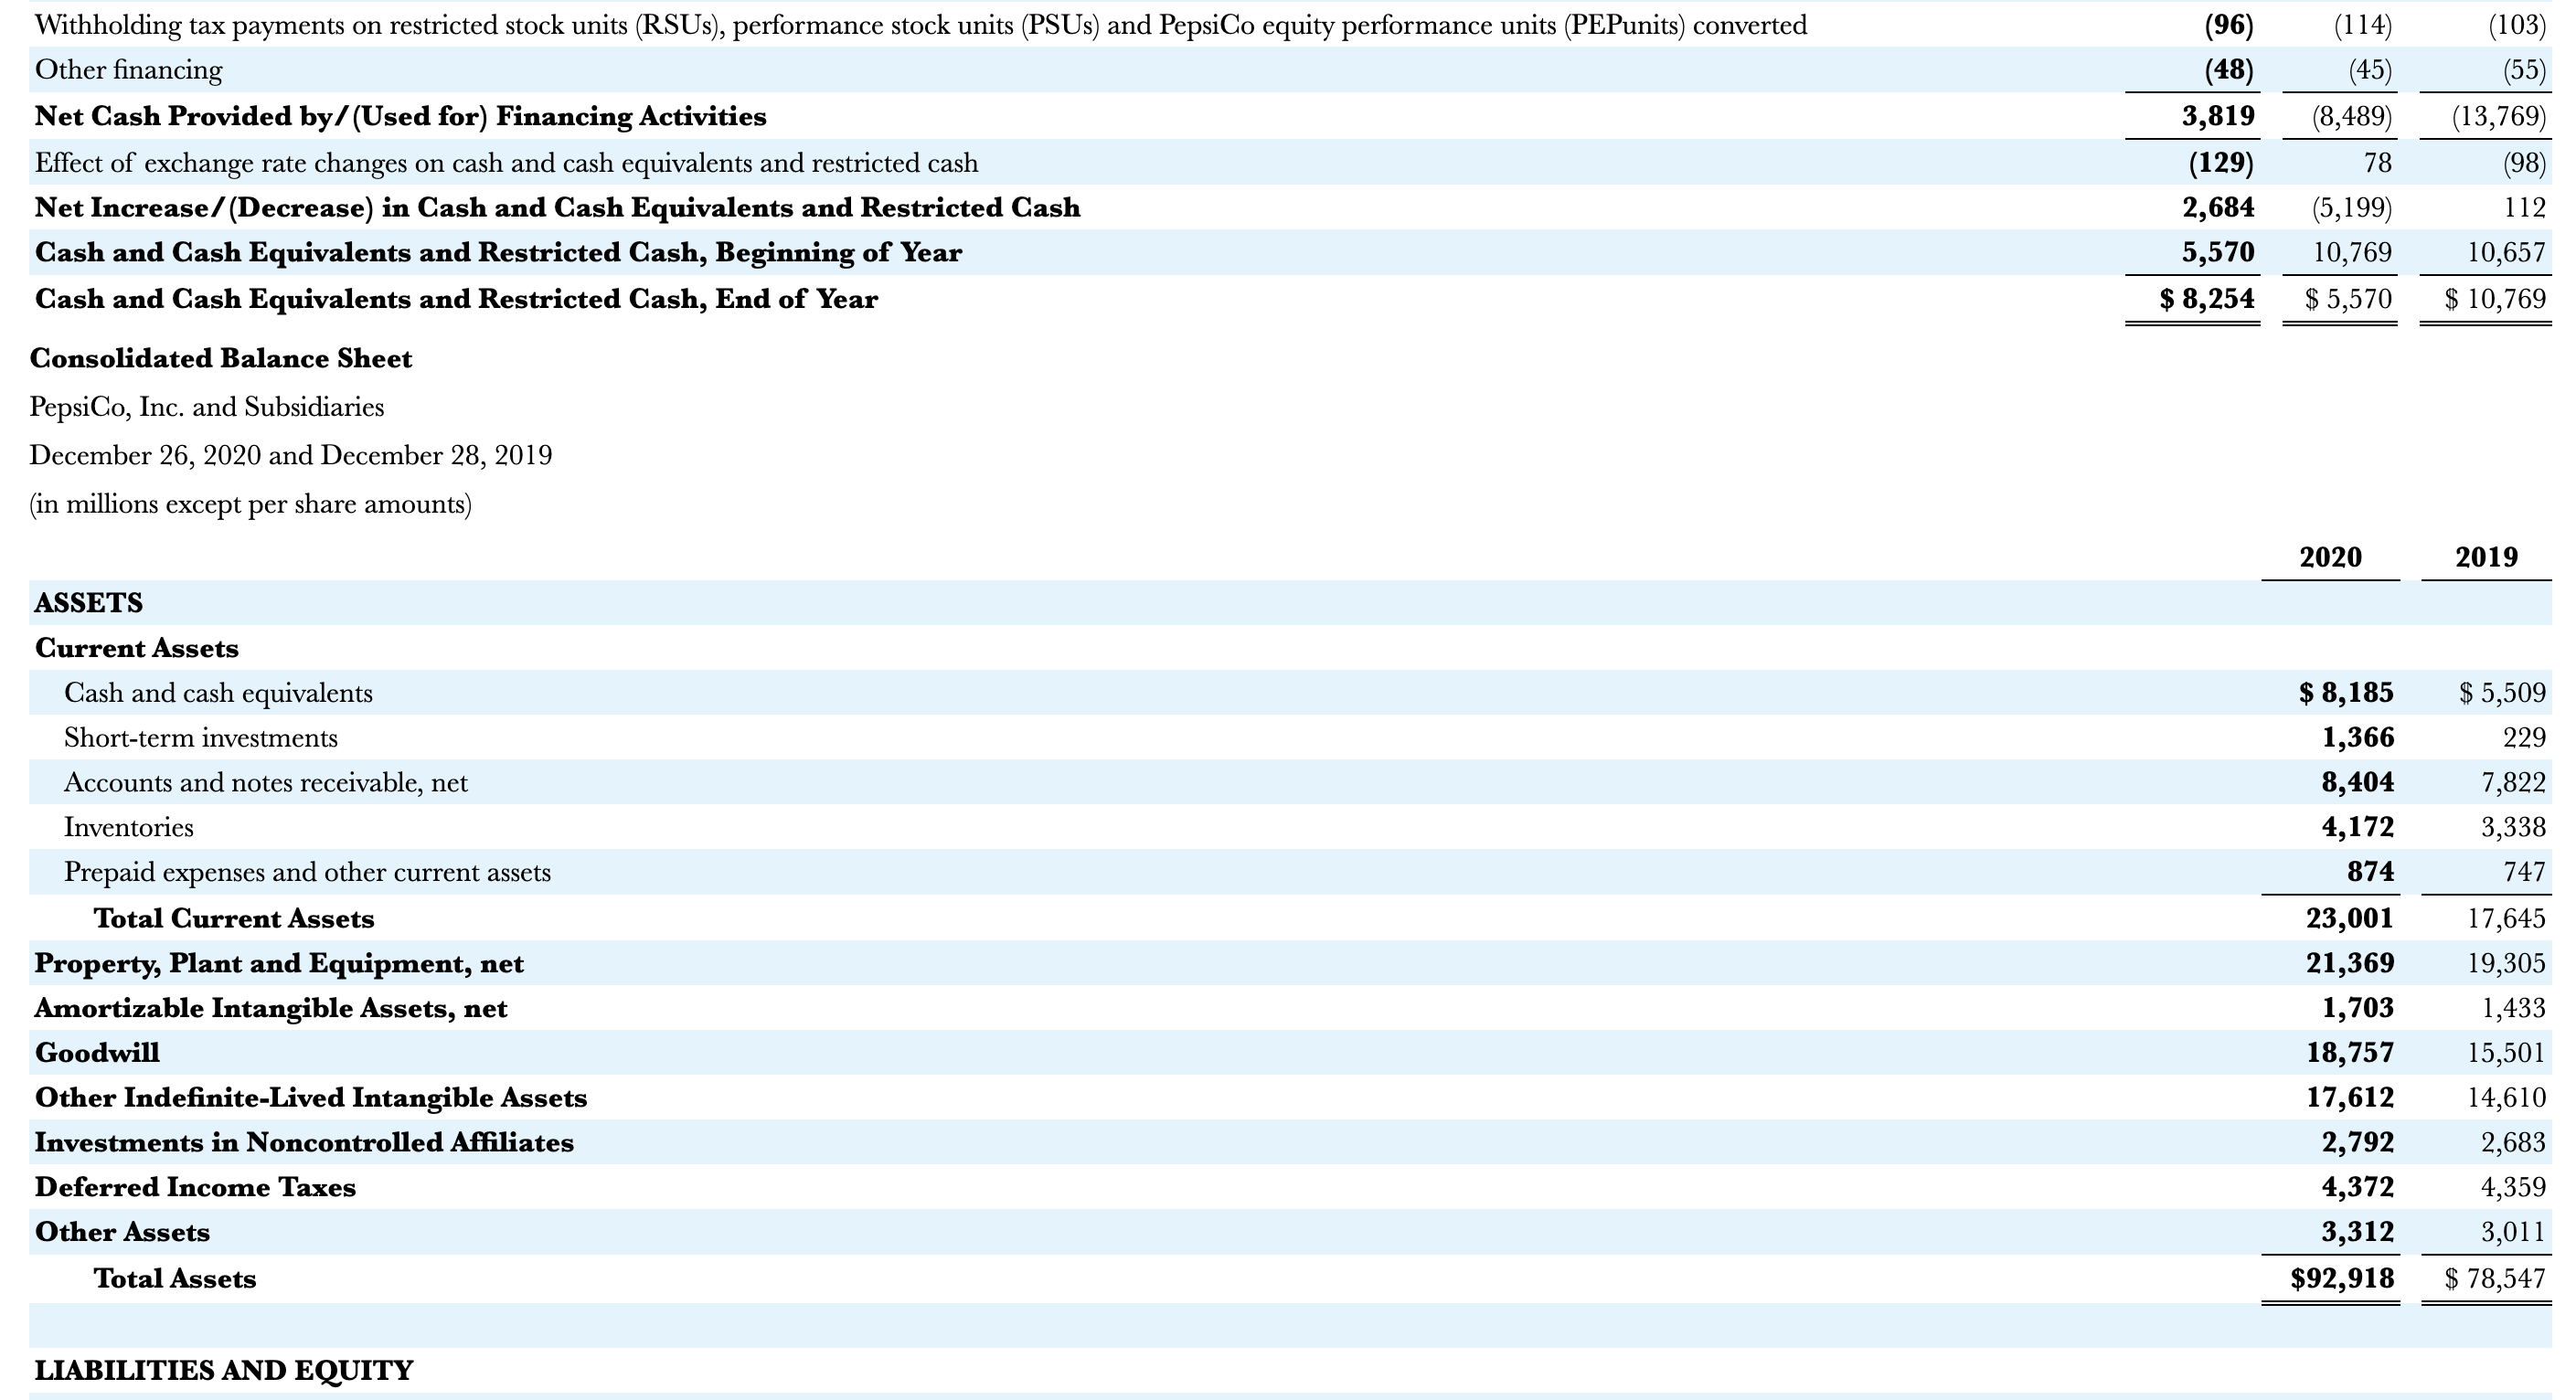
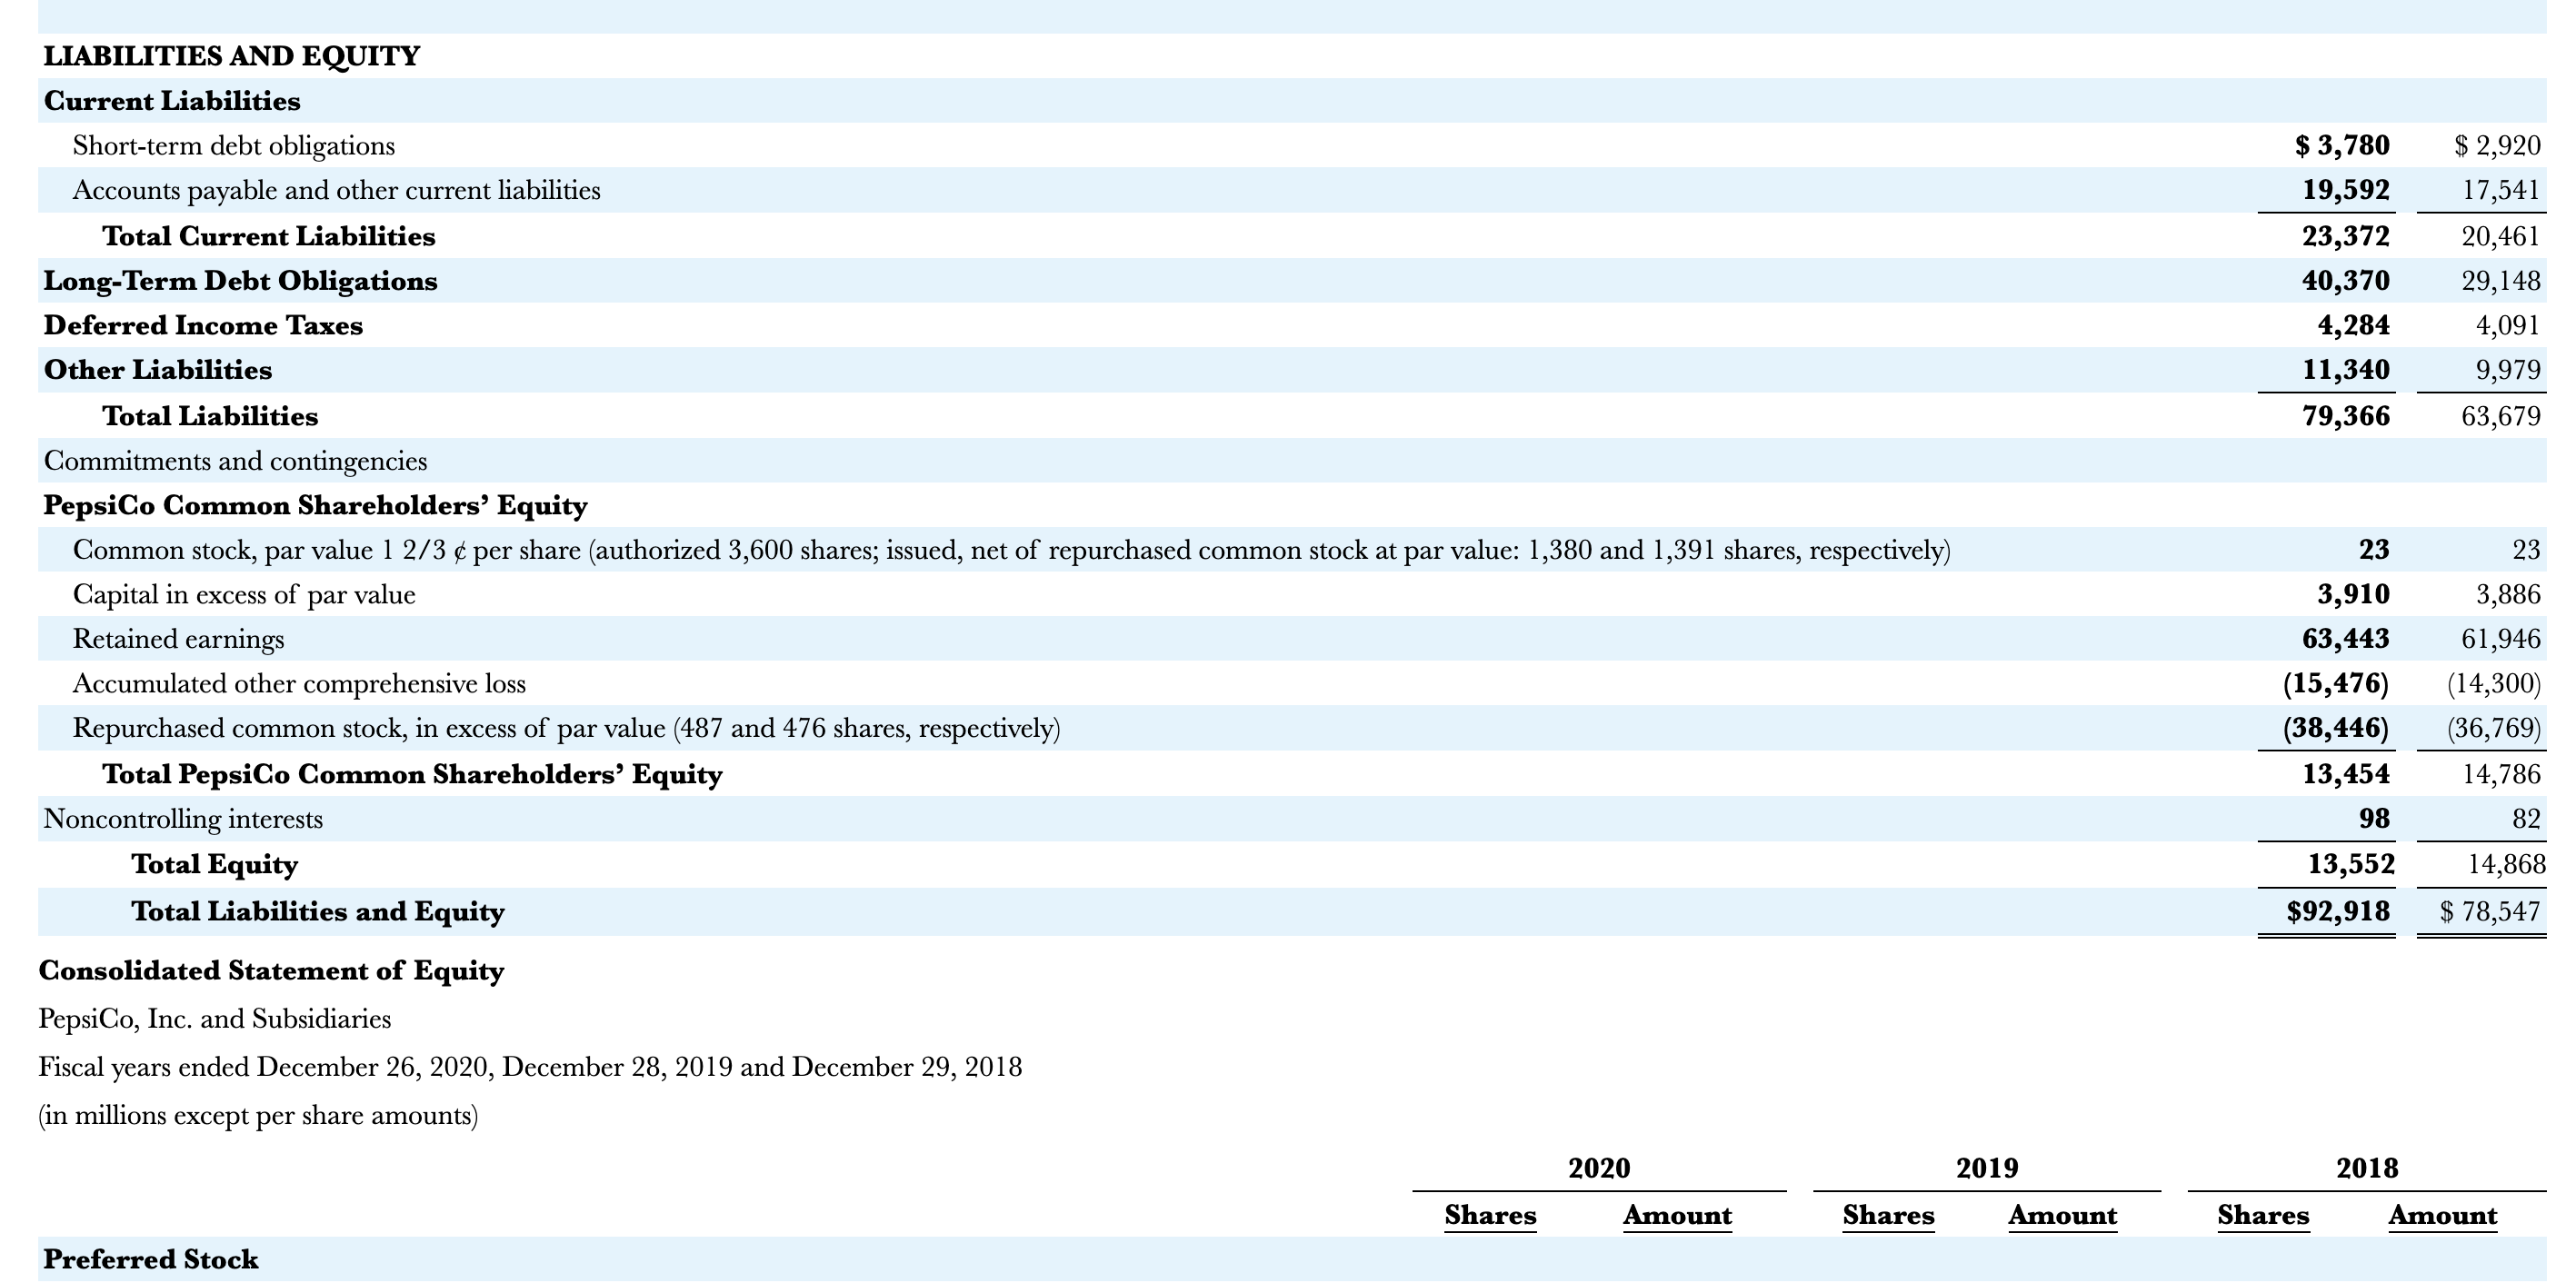
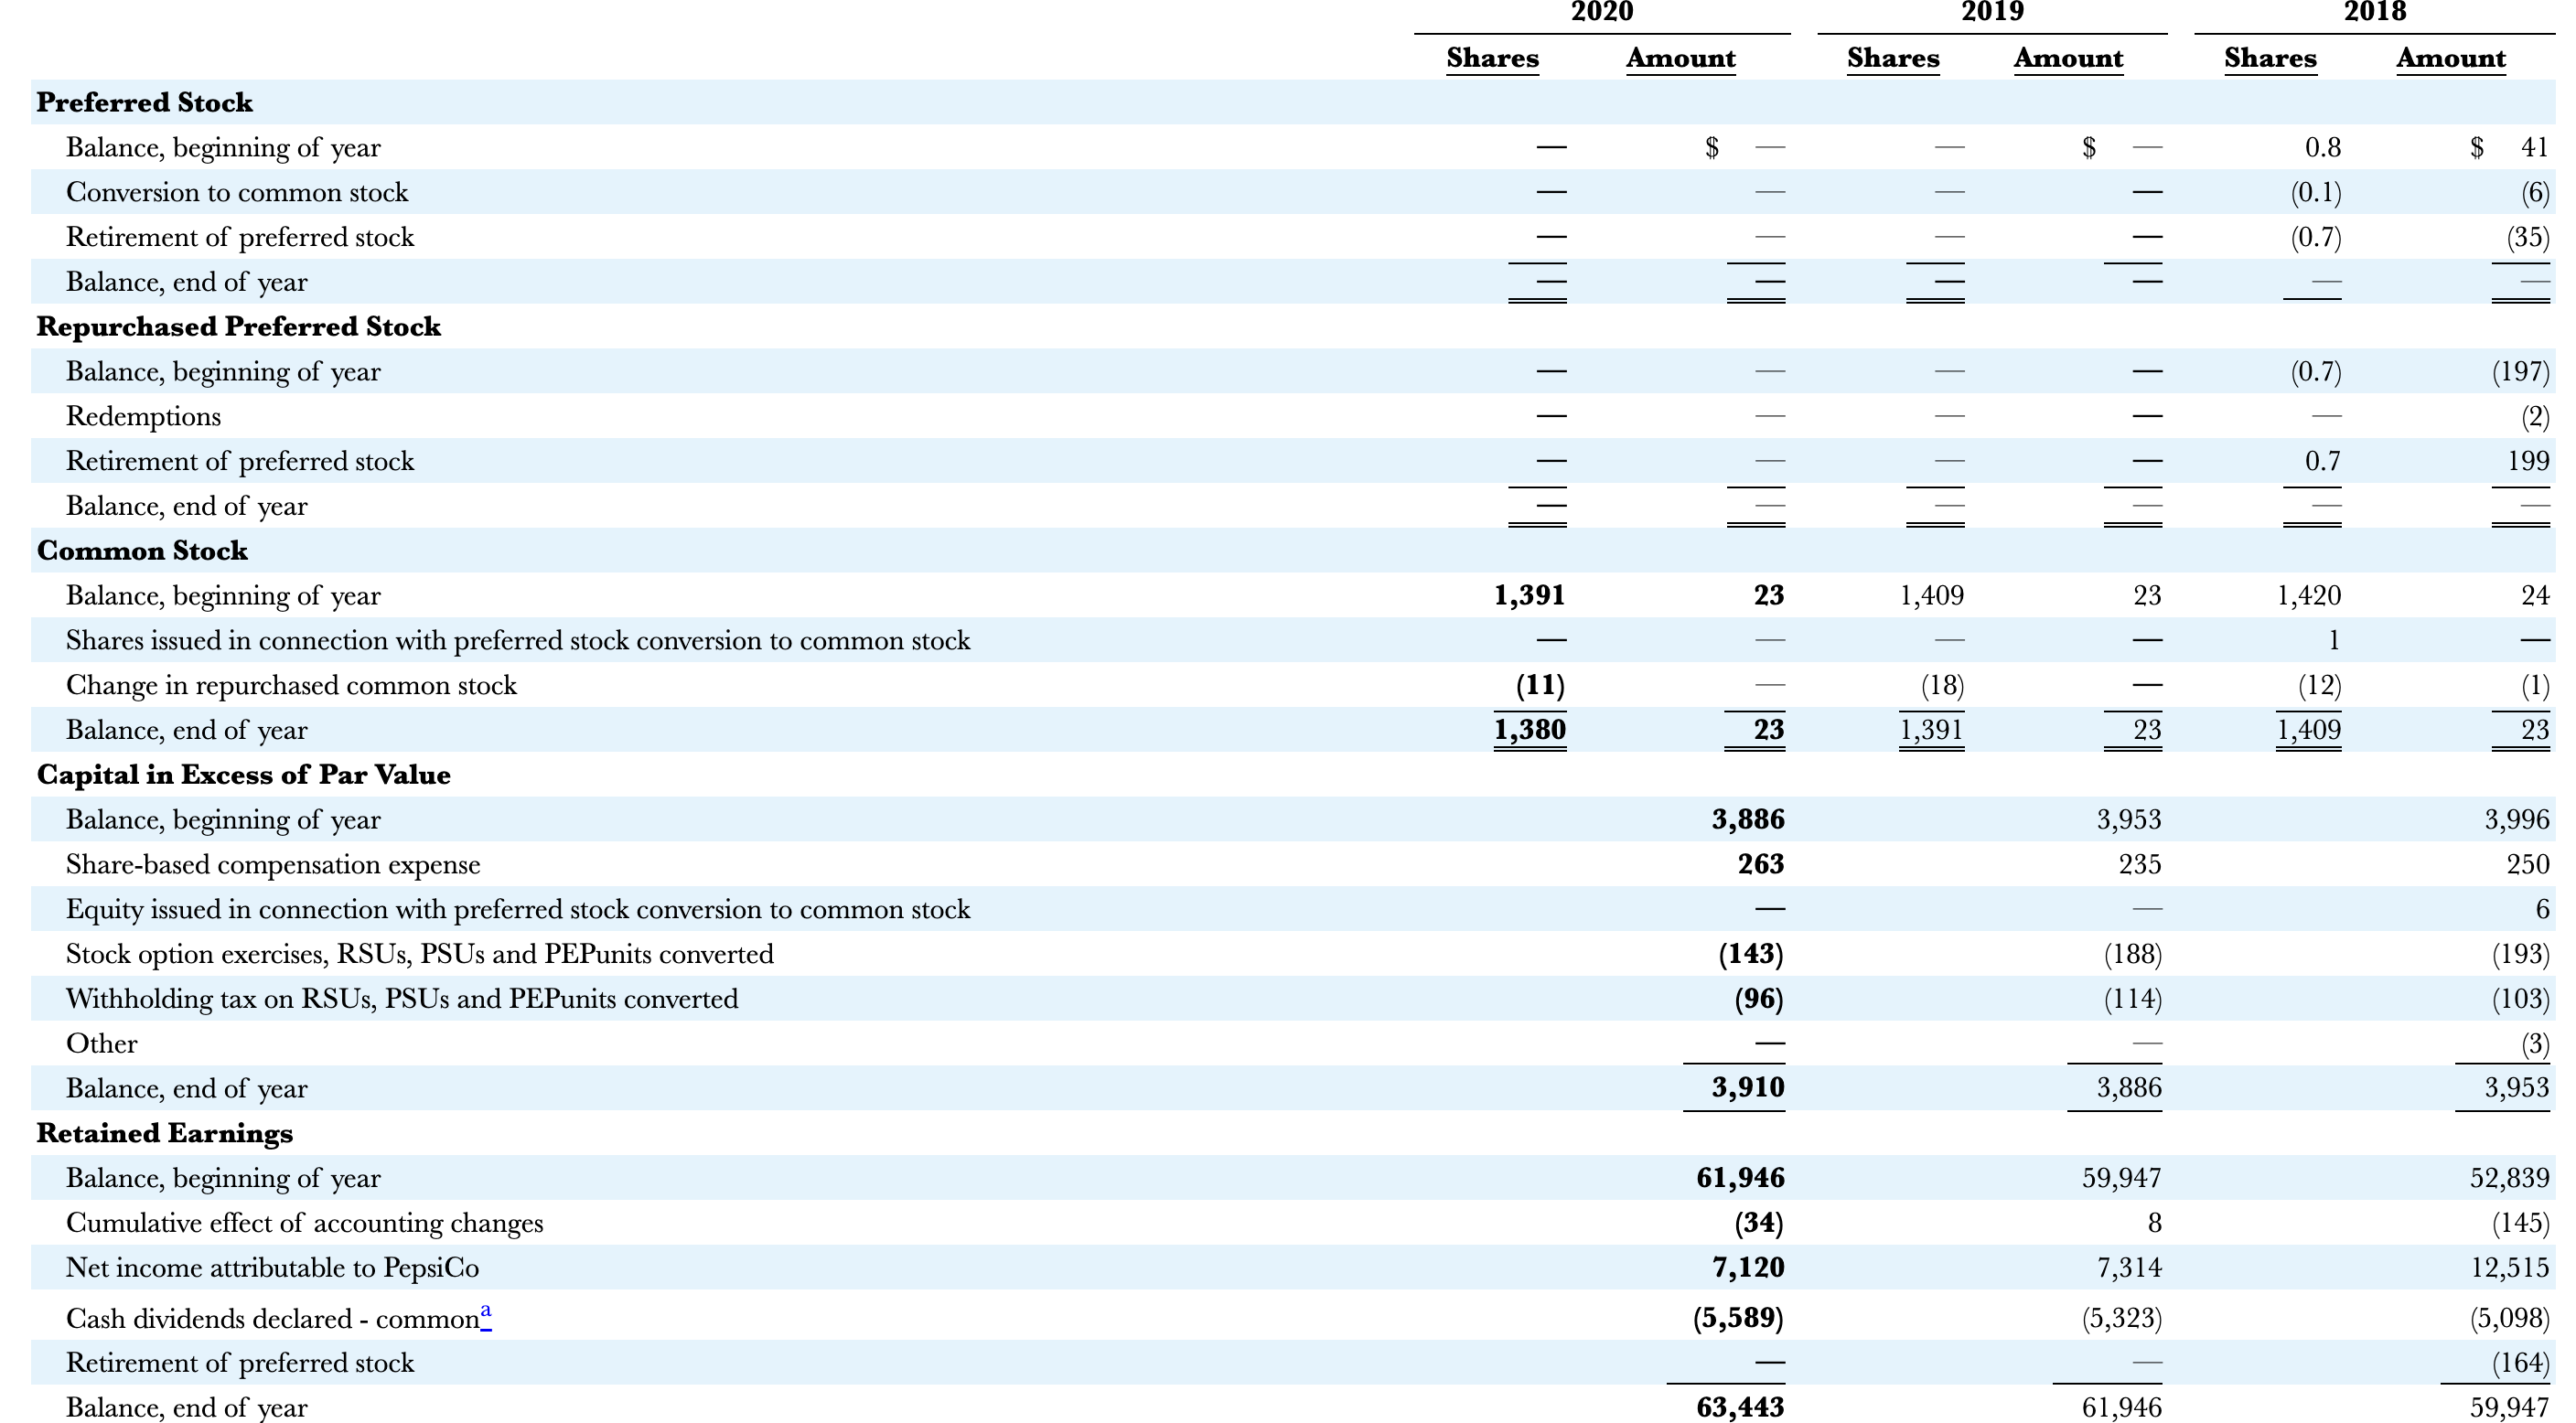
Additional Information needed for Question 2:
Pepsi Total assets 2018 = 77,648
Pepsi LT debt 2018 = 28,295
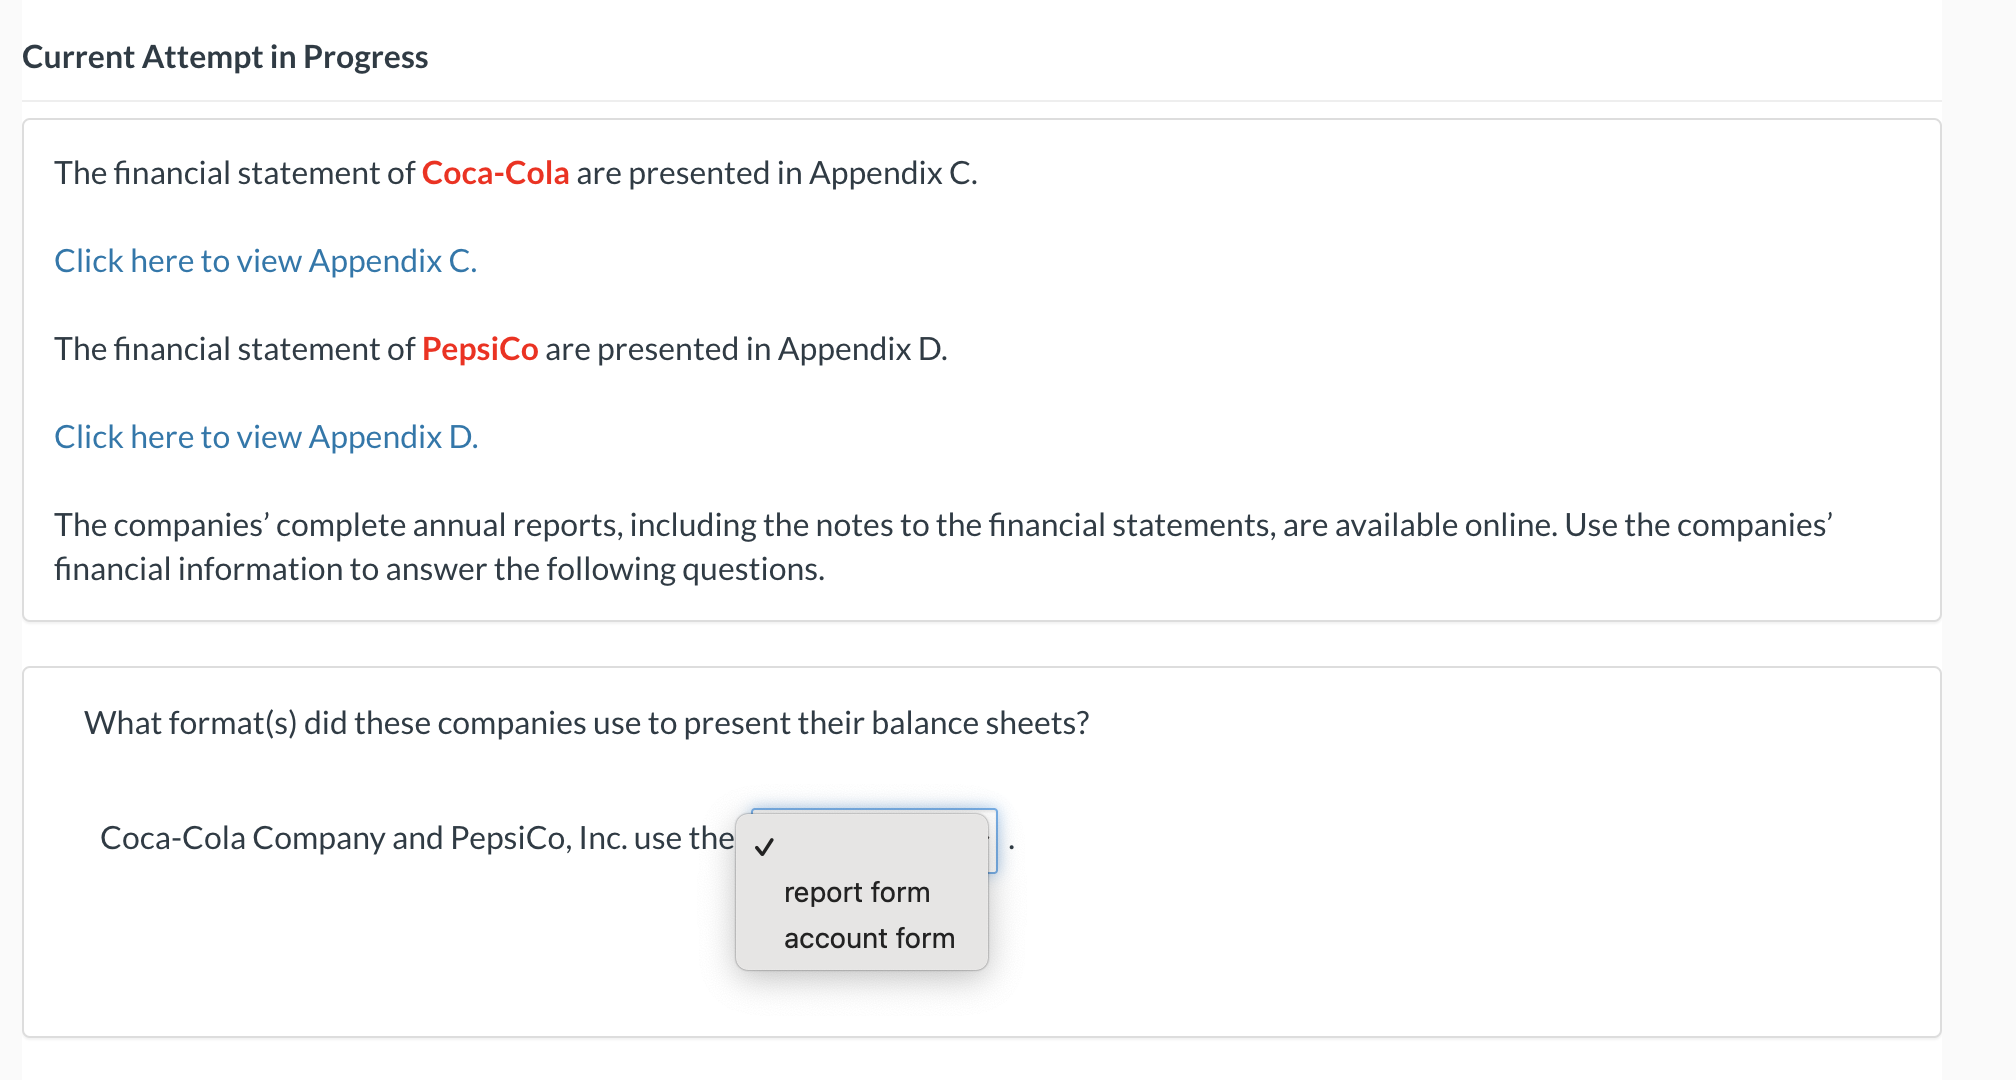
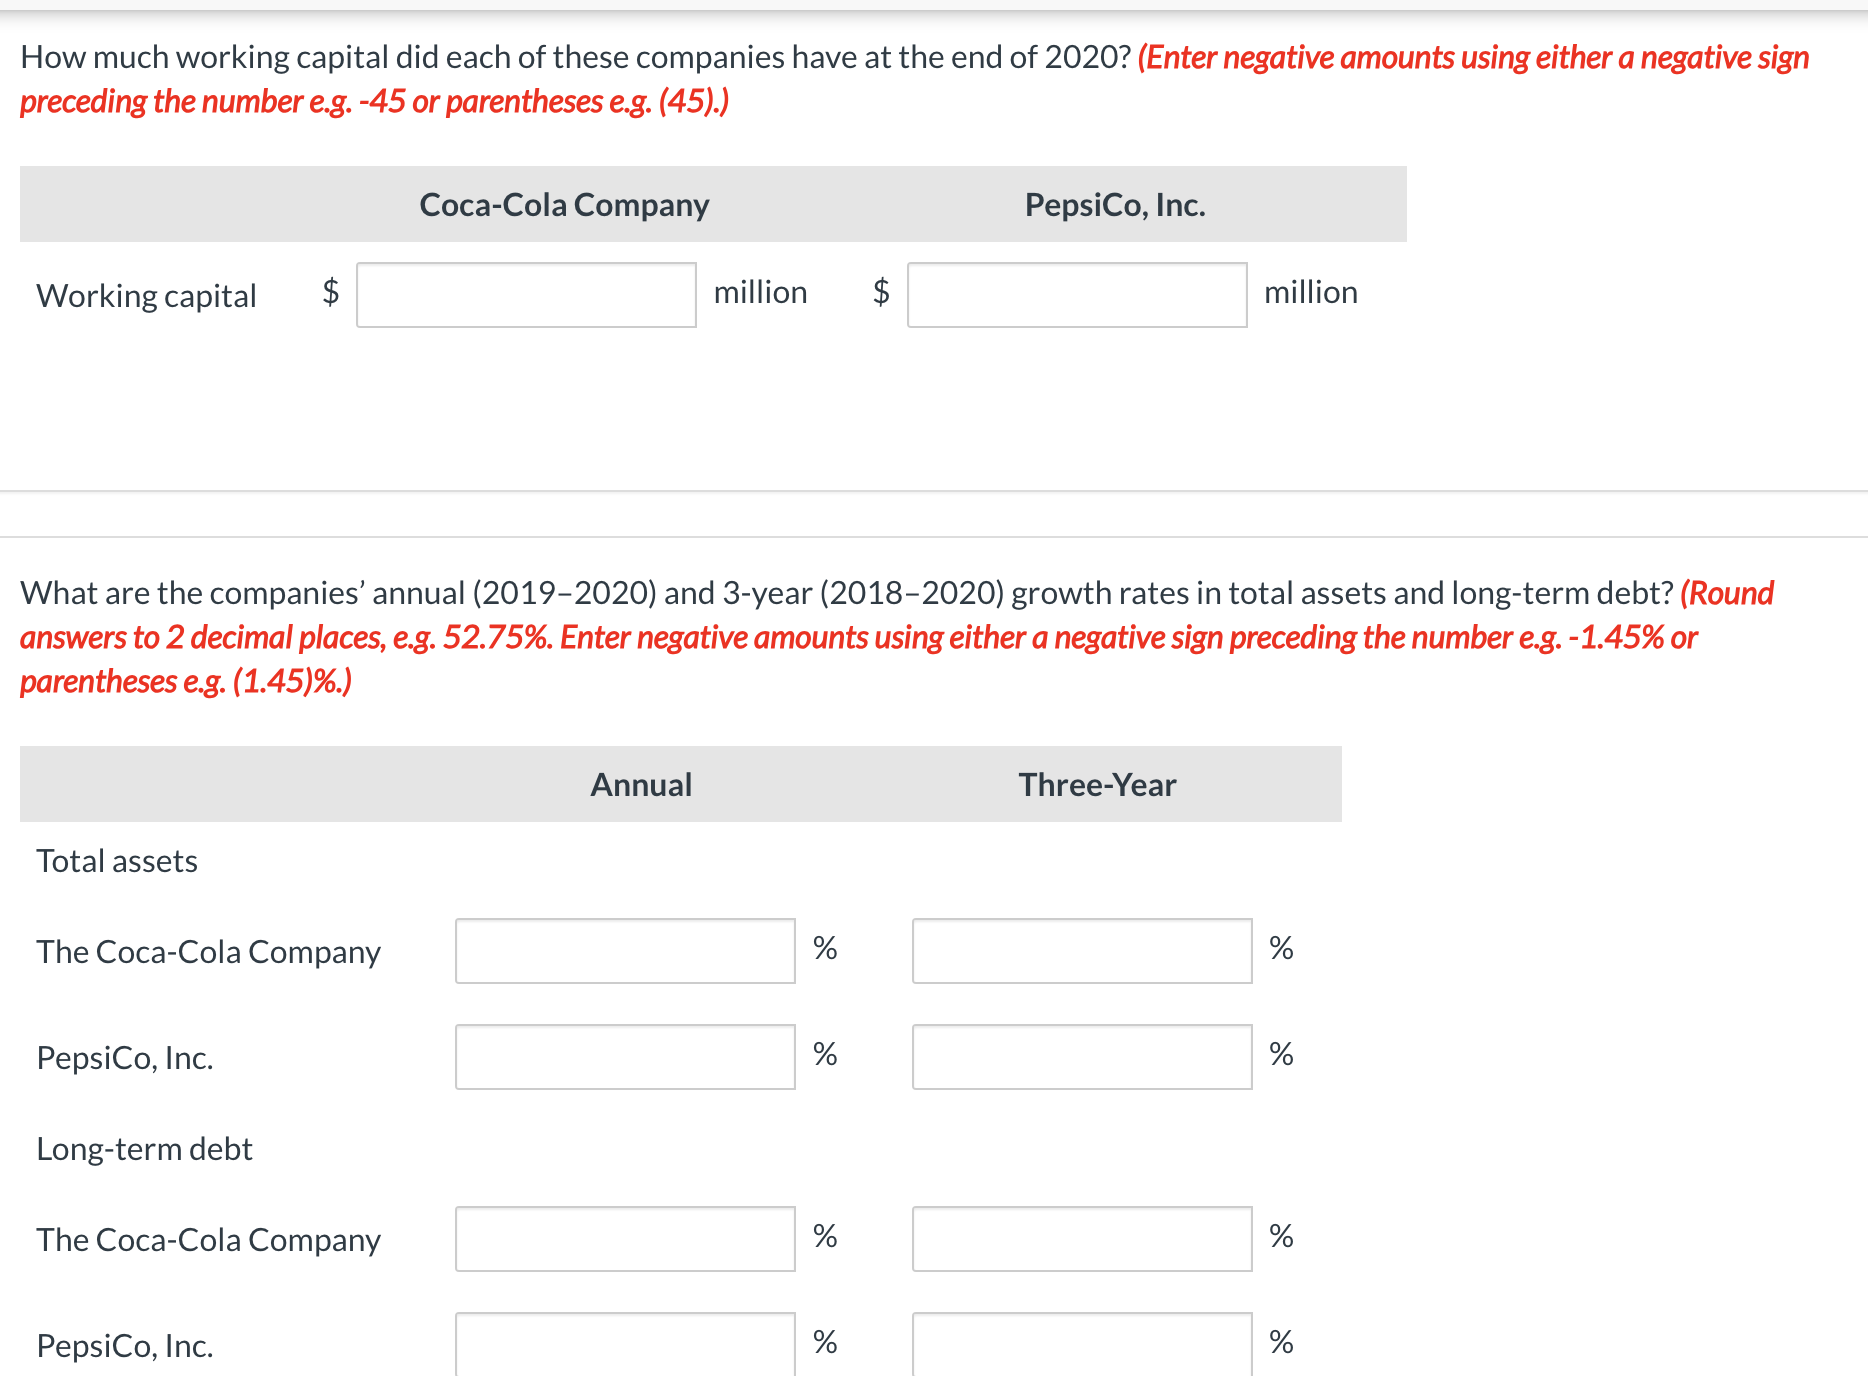
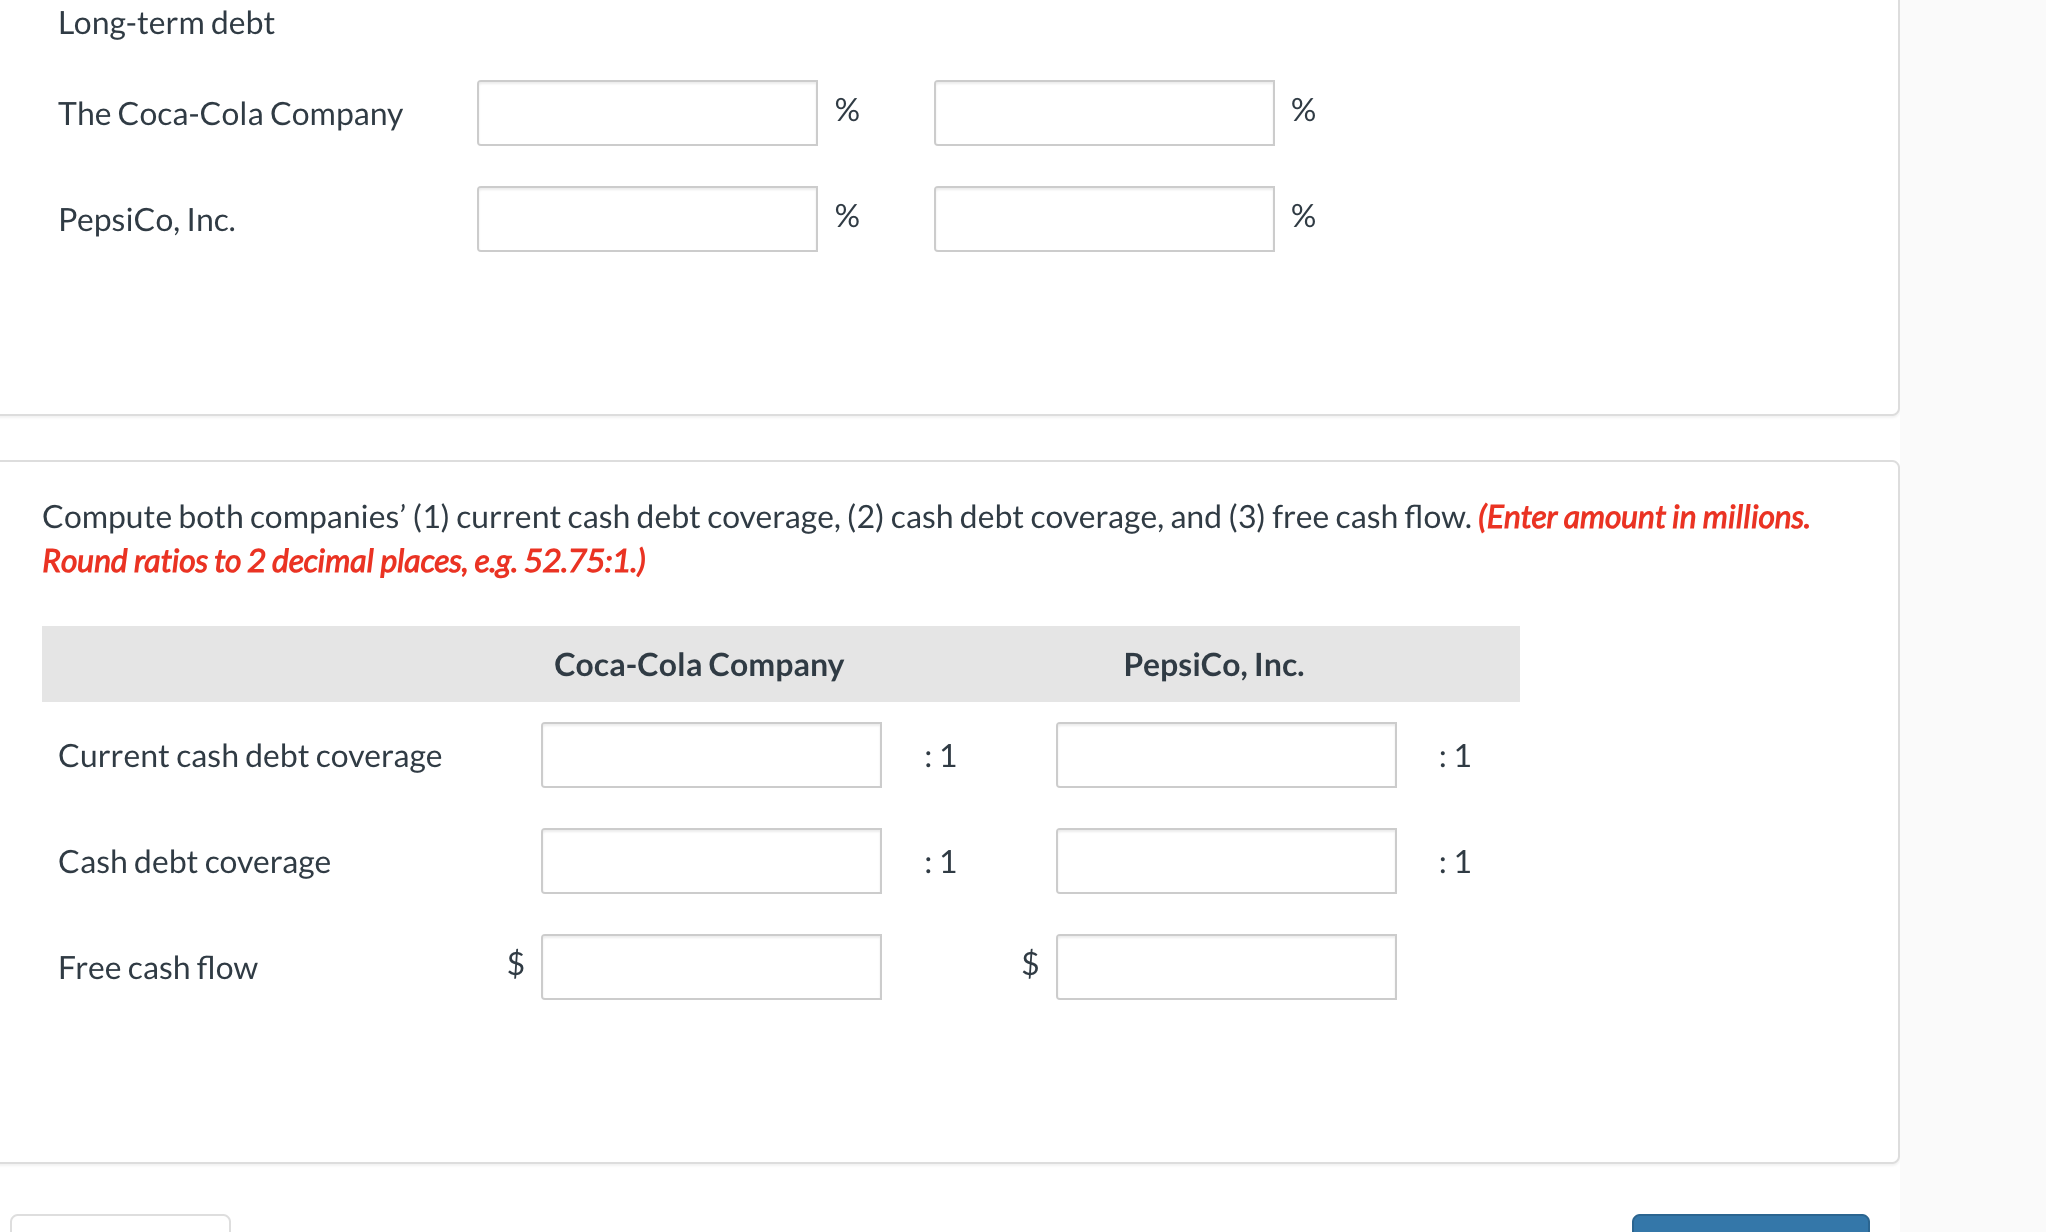
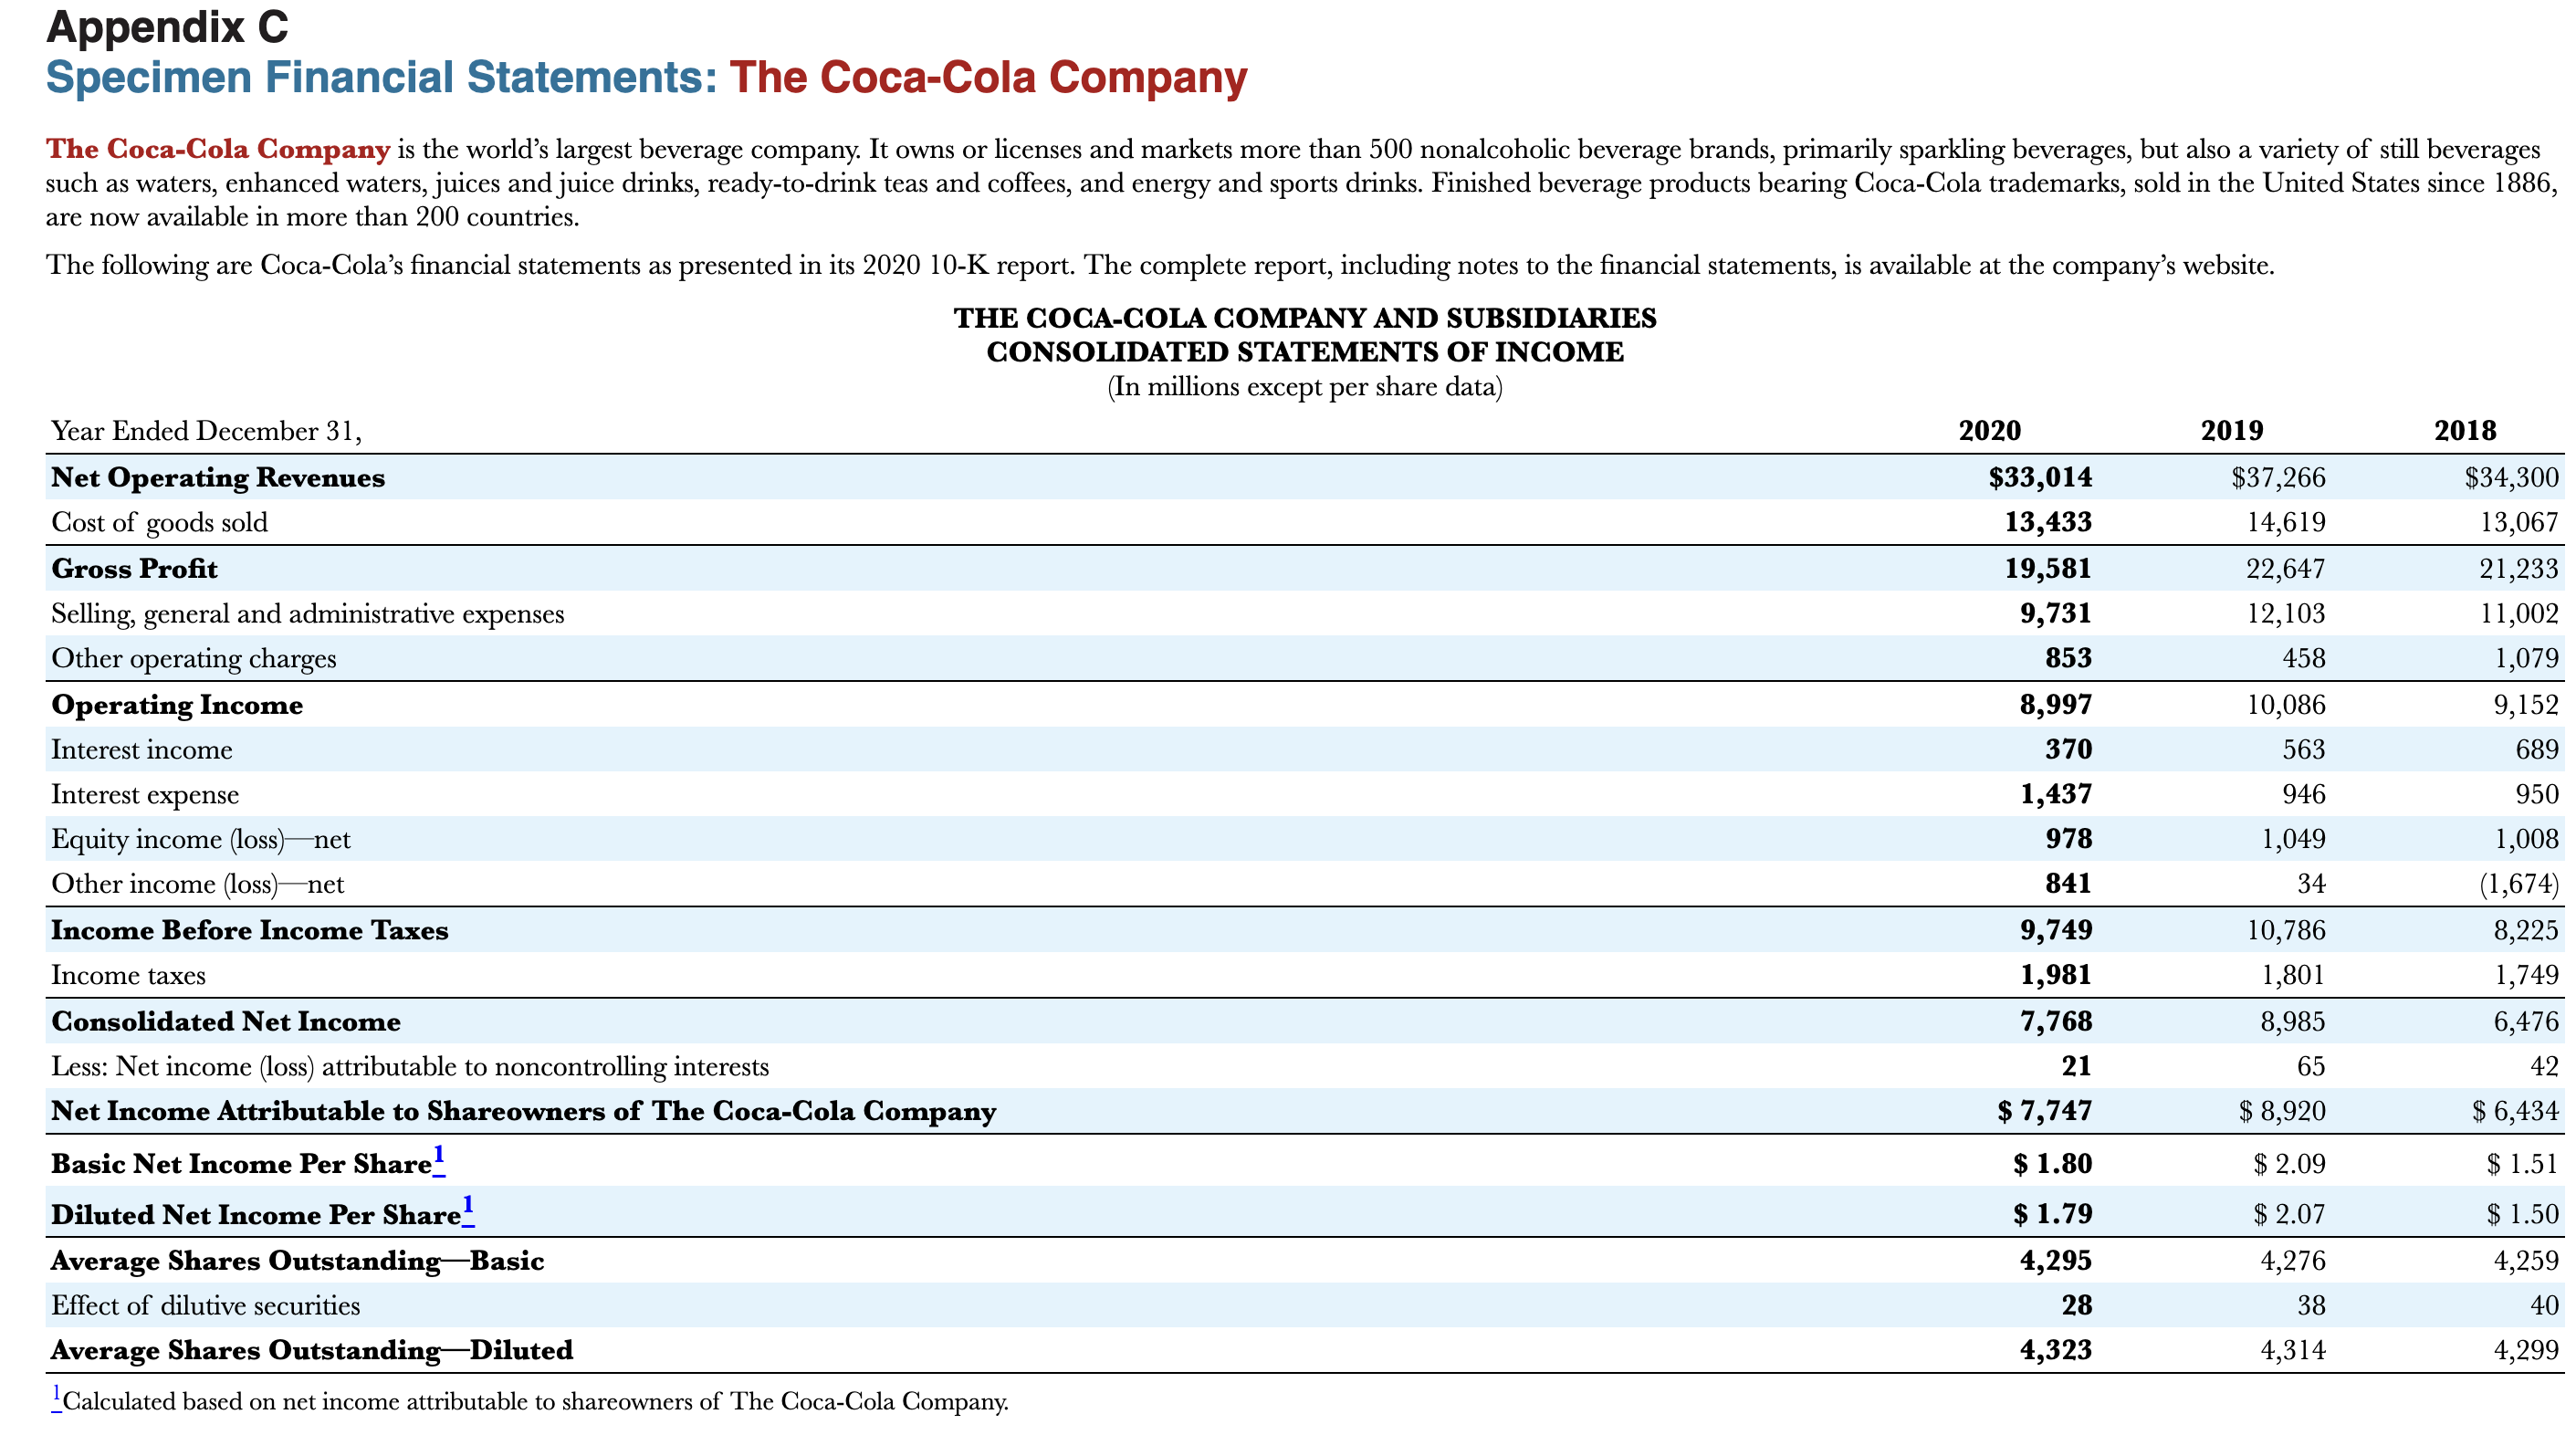
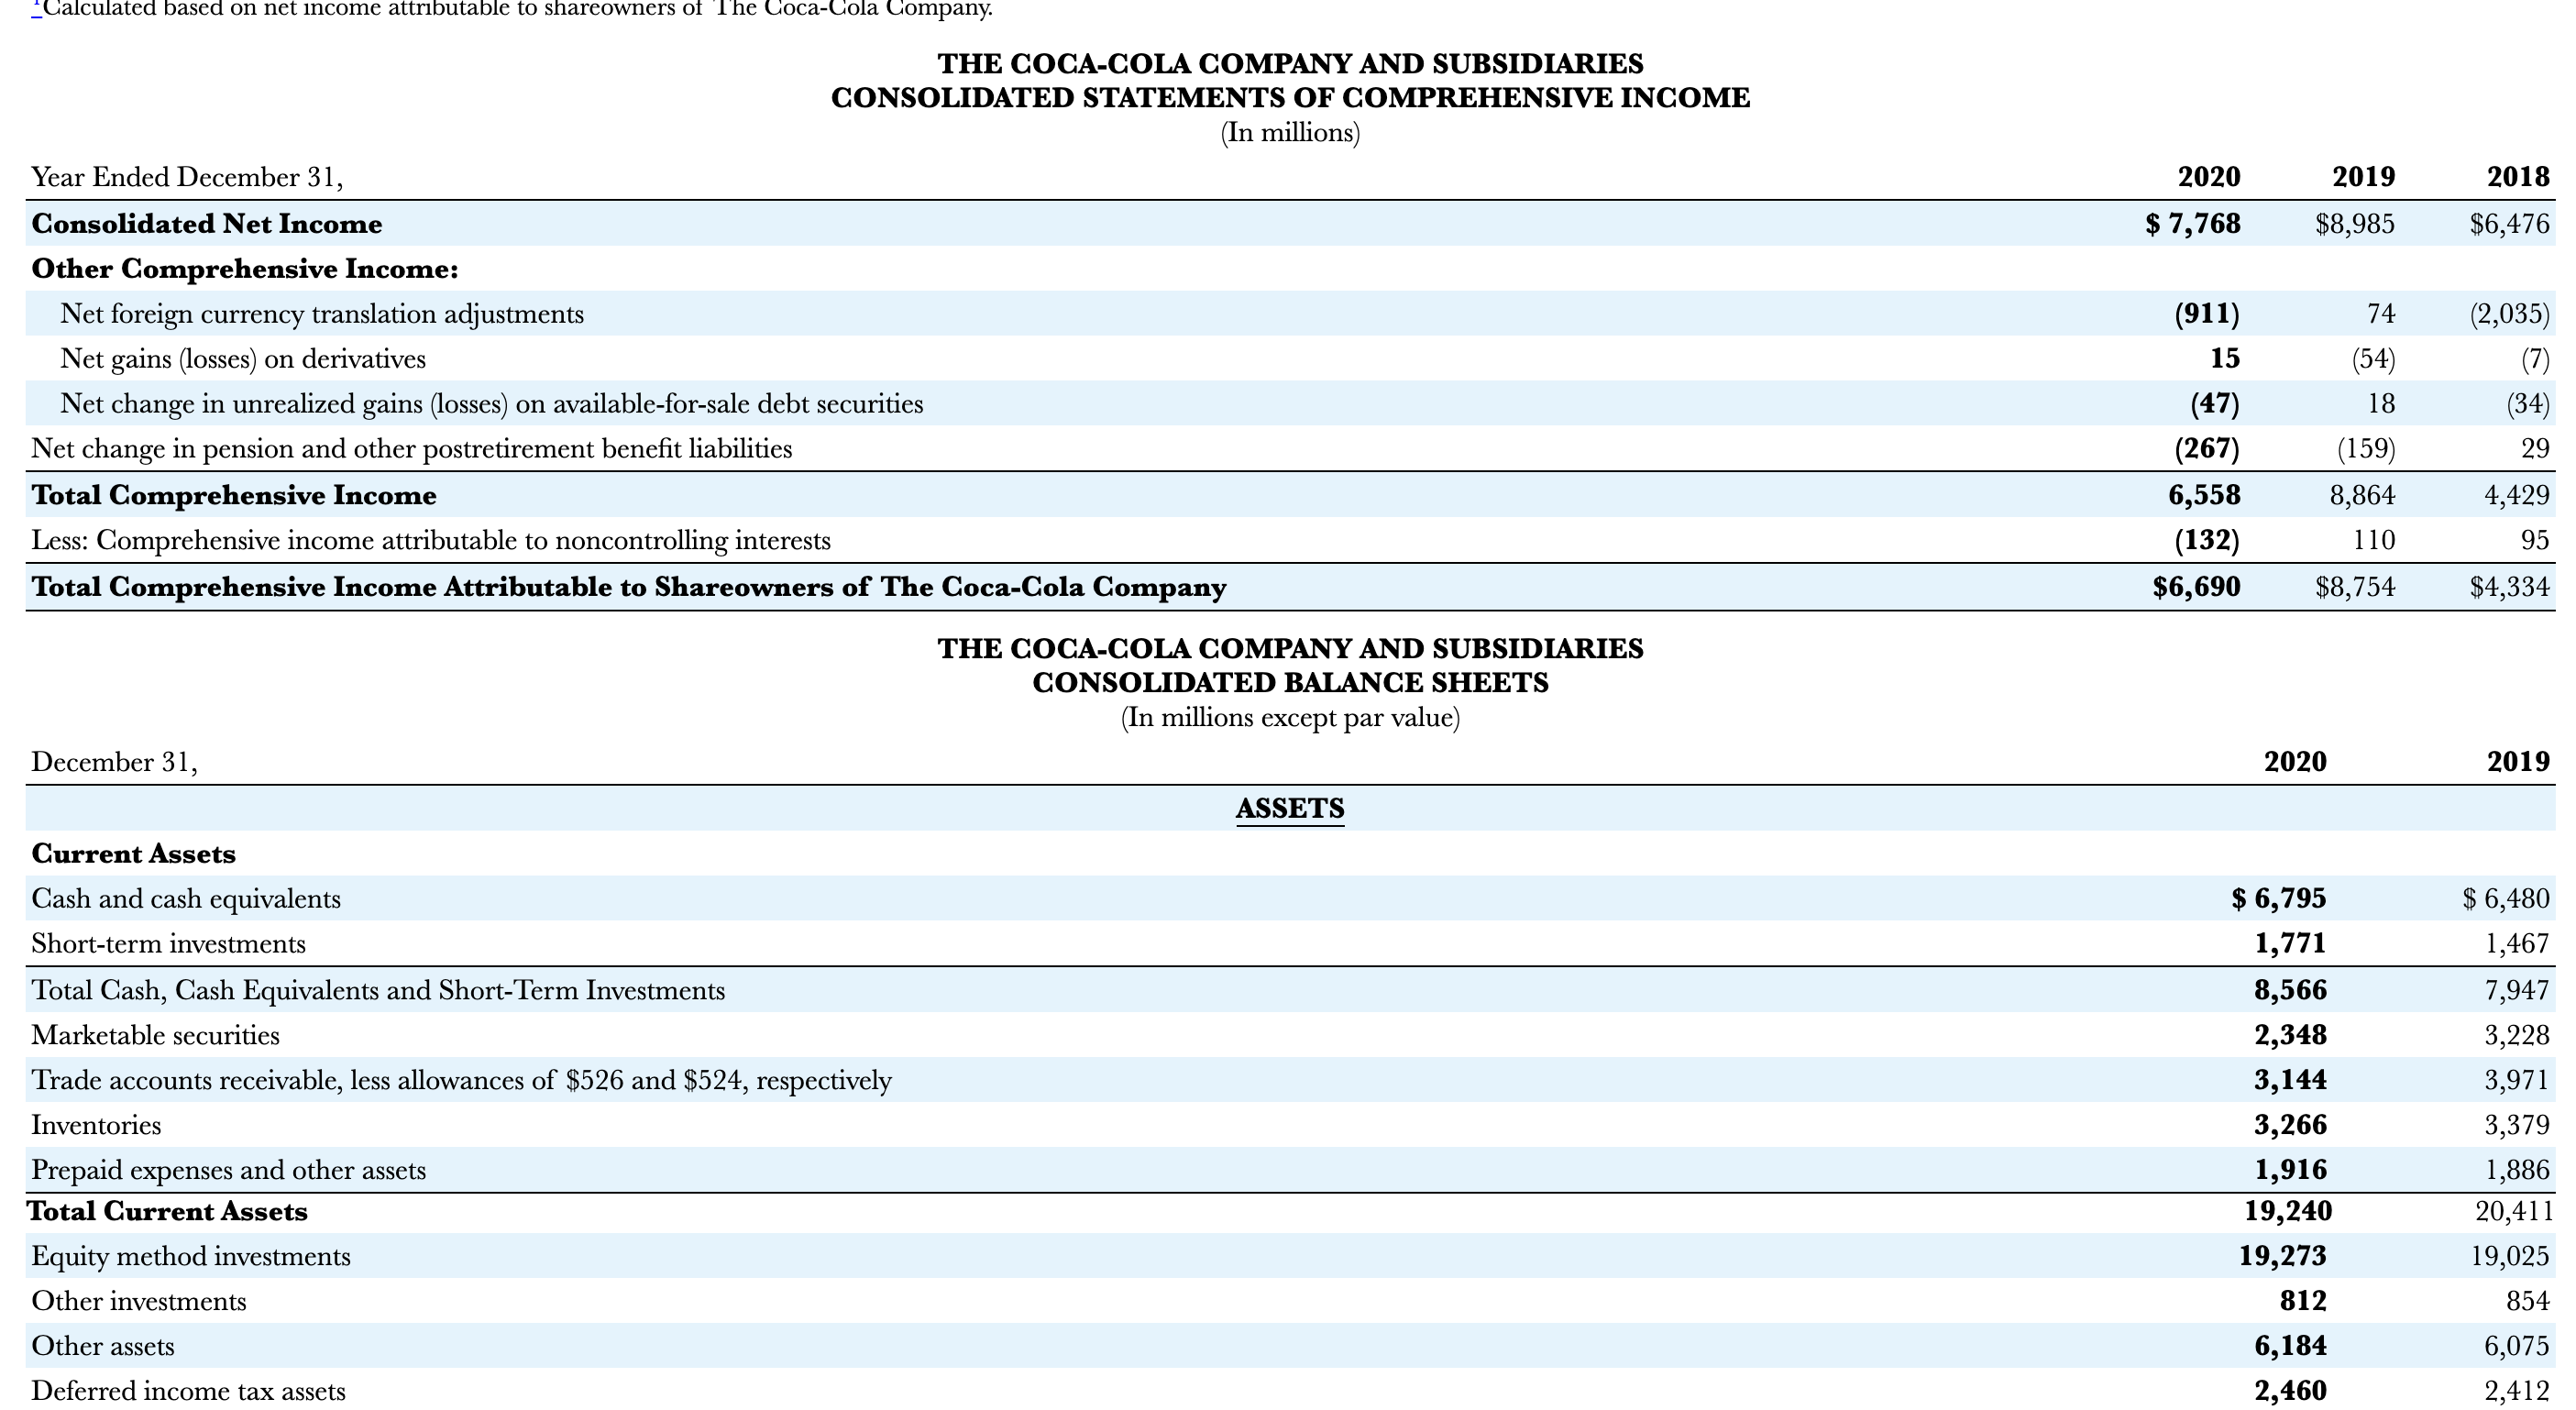
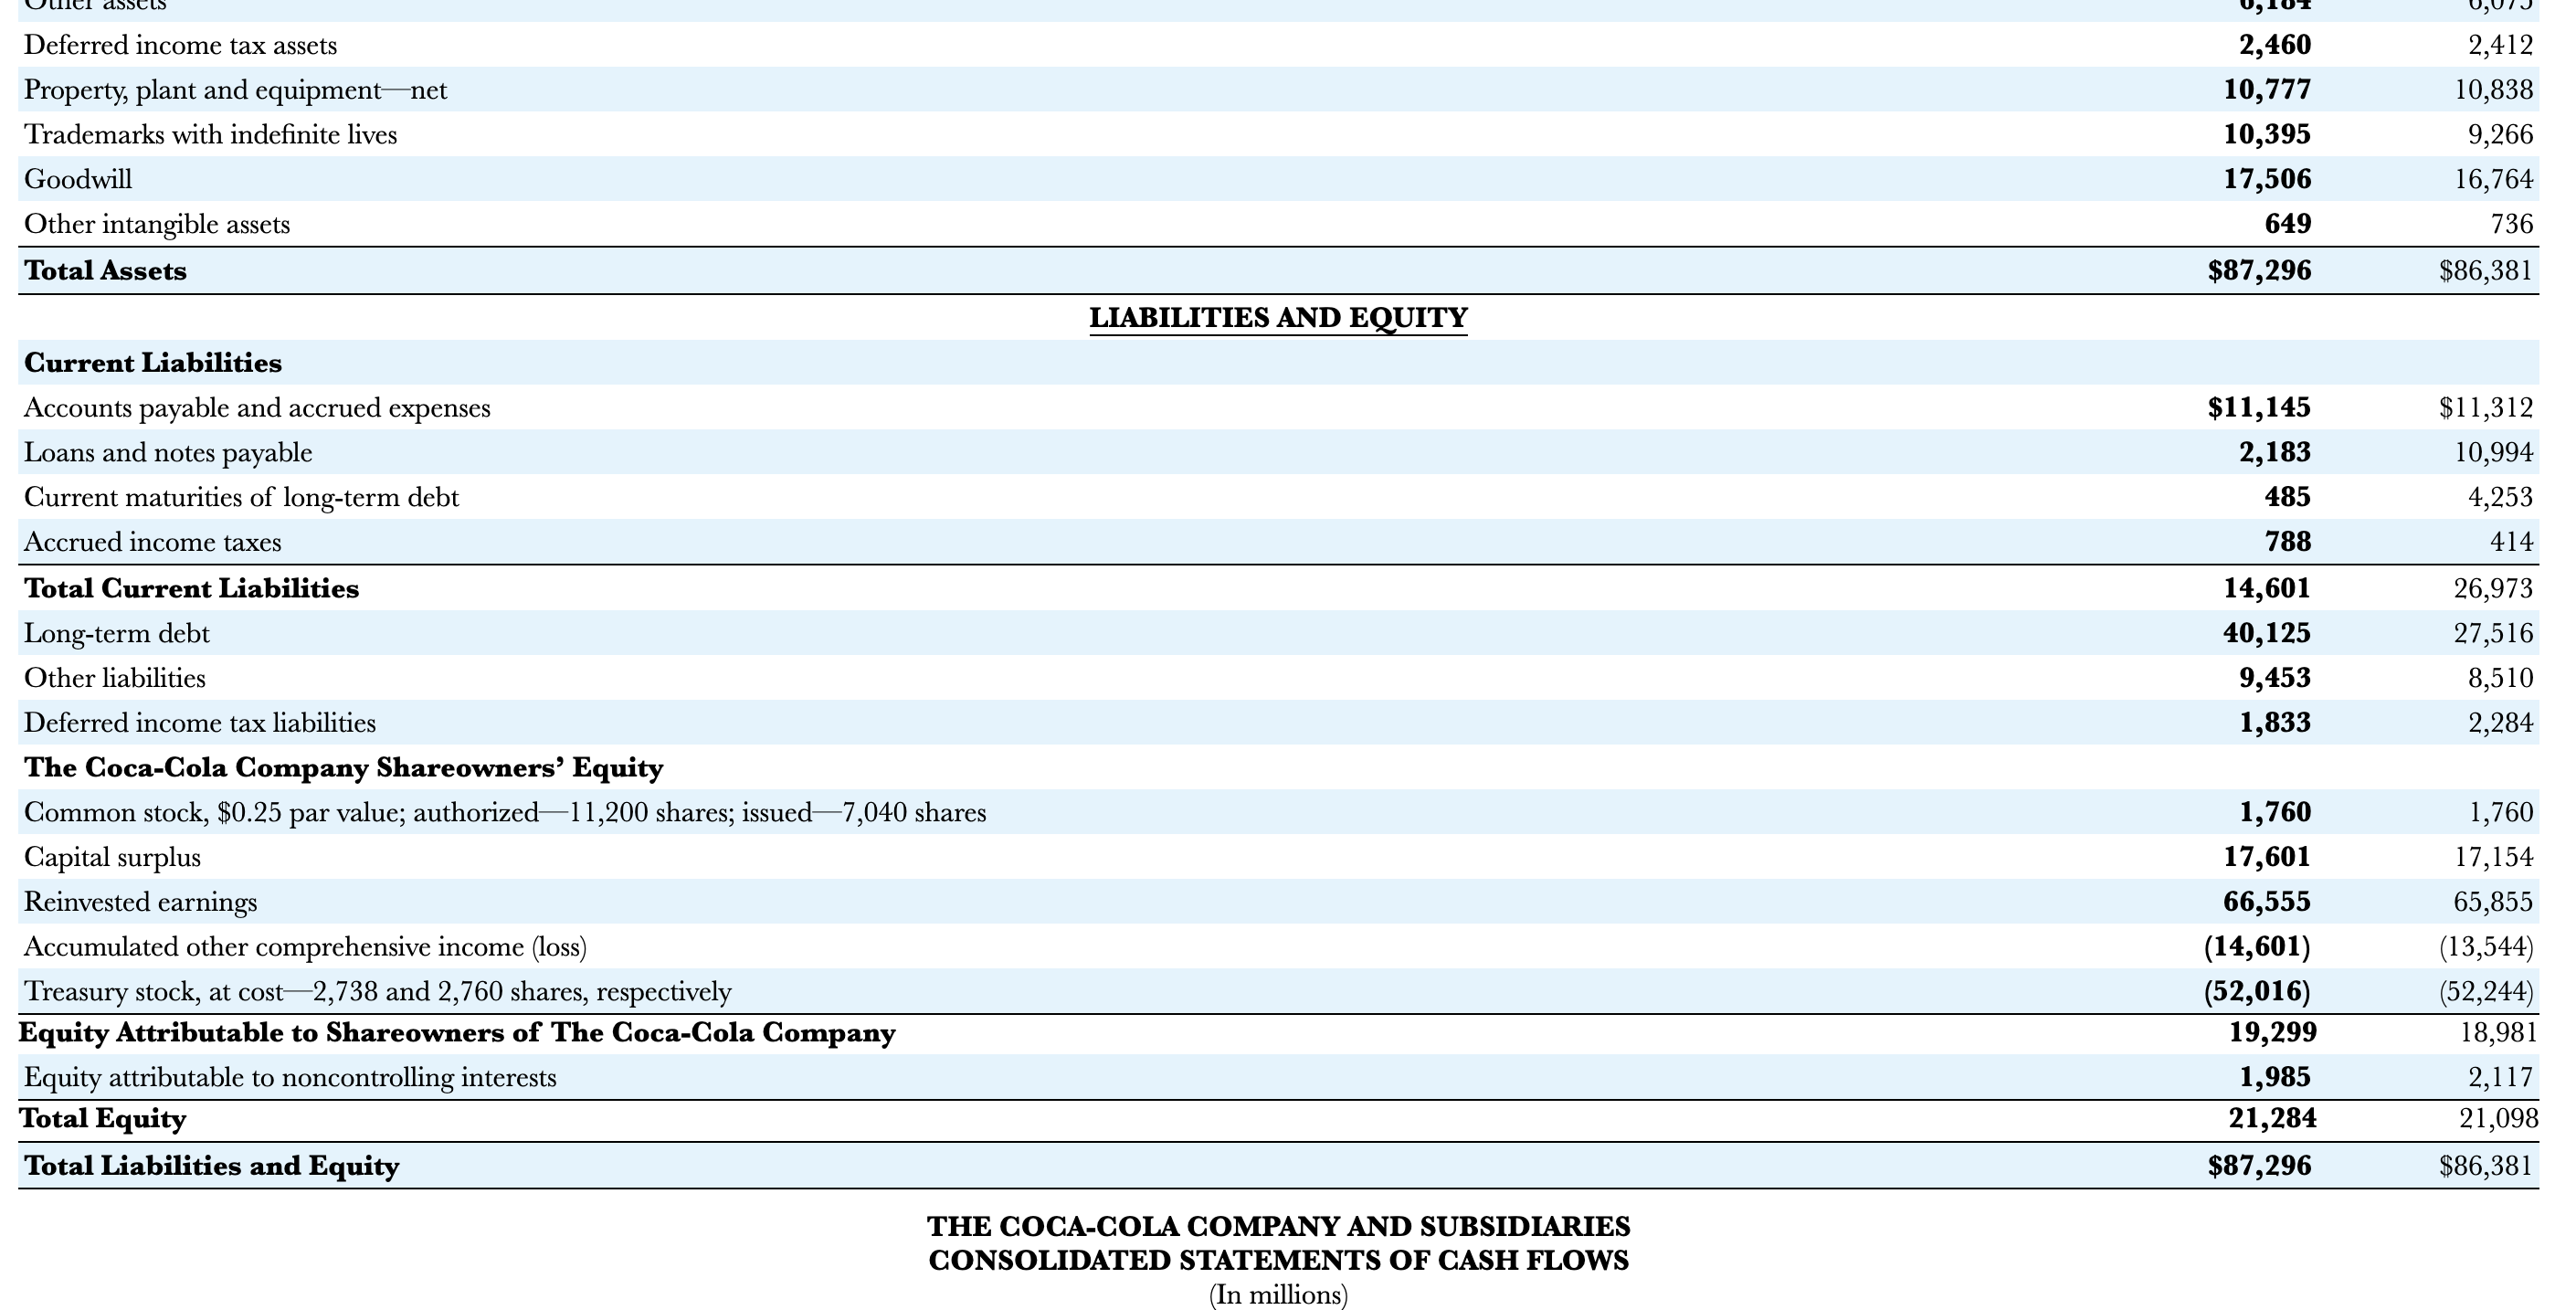
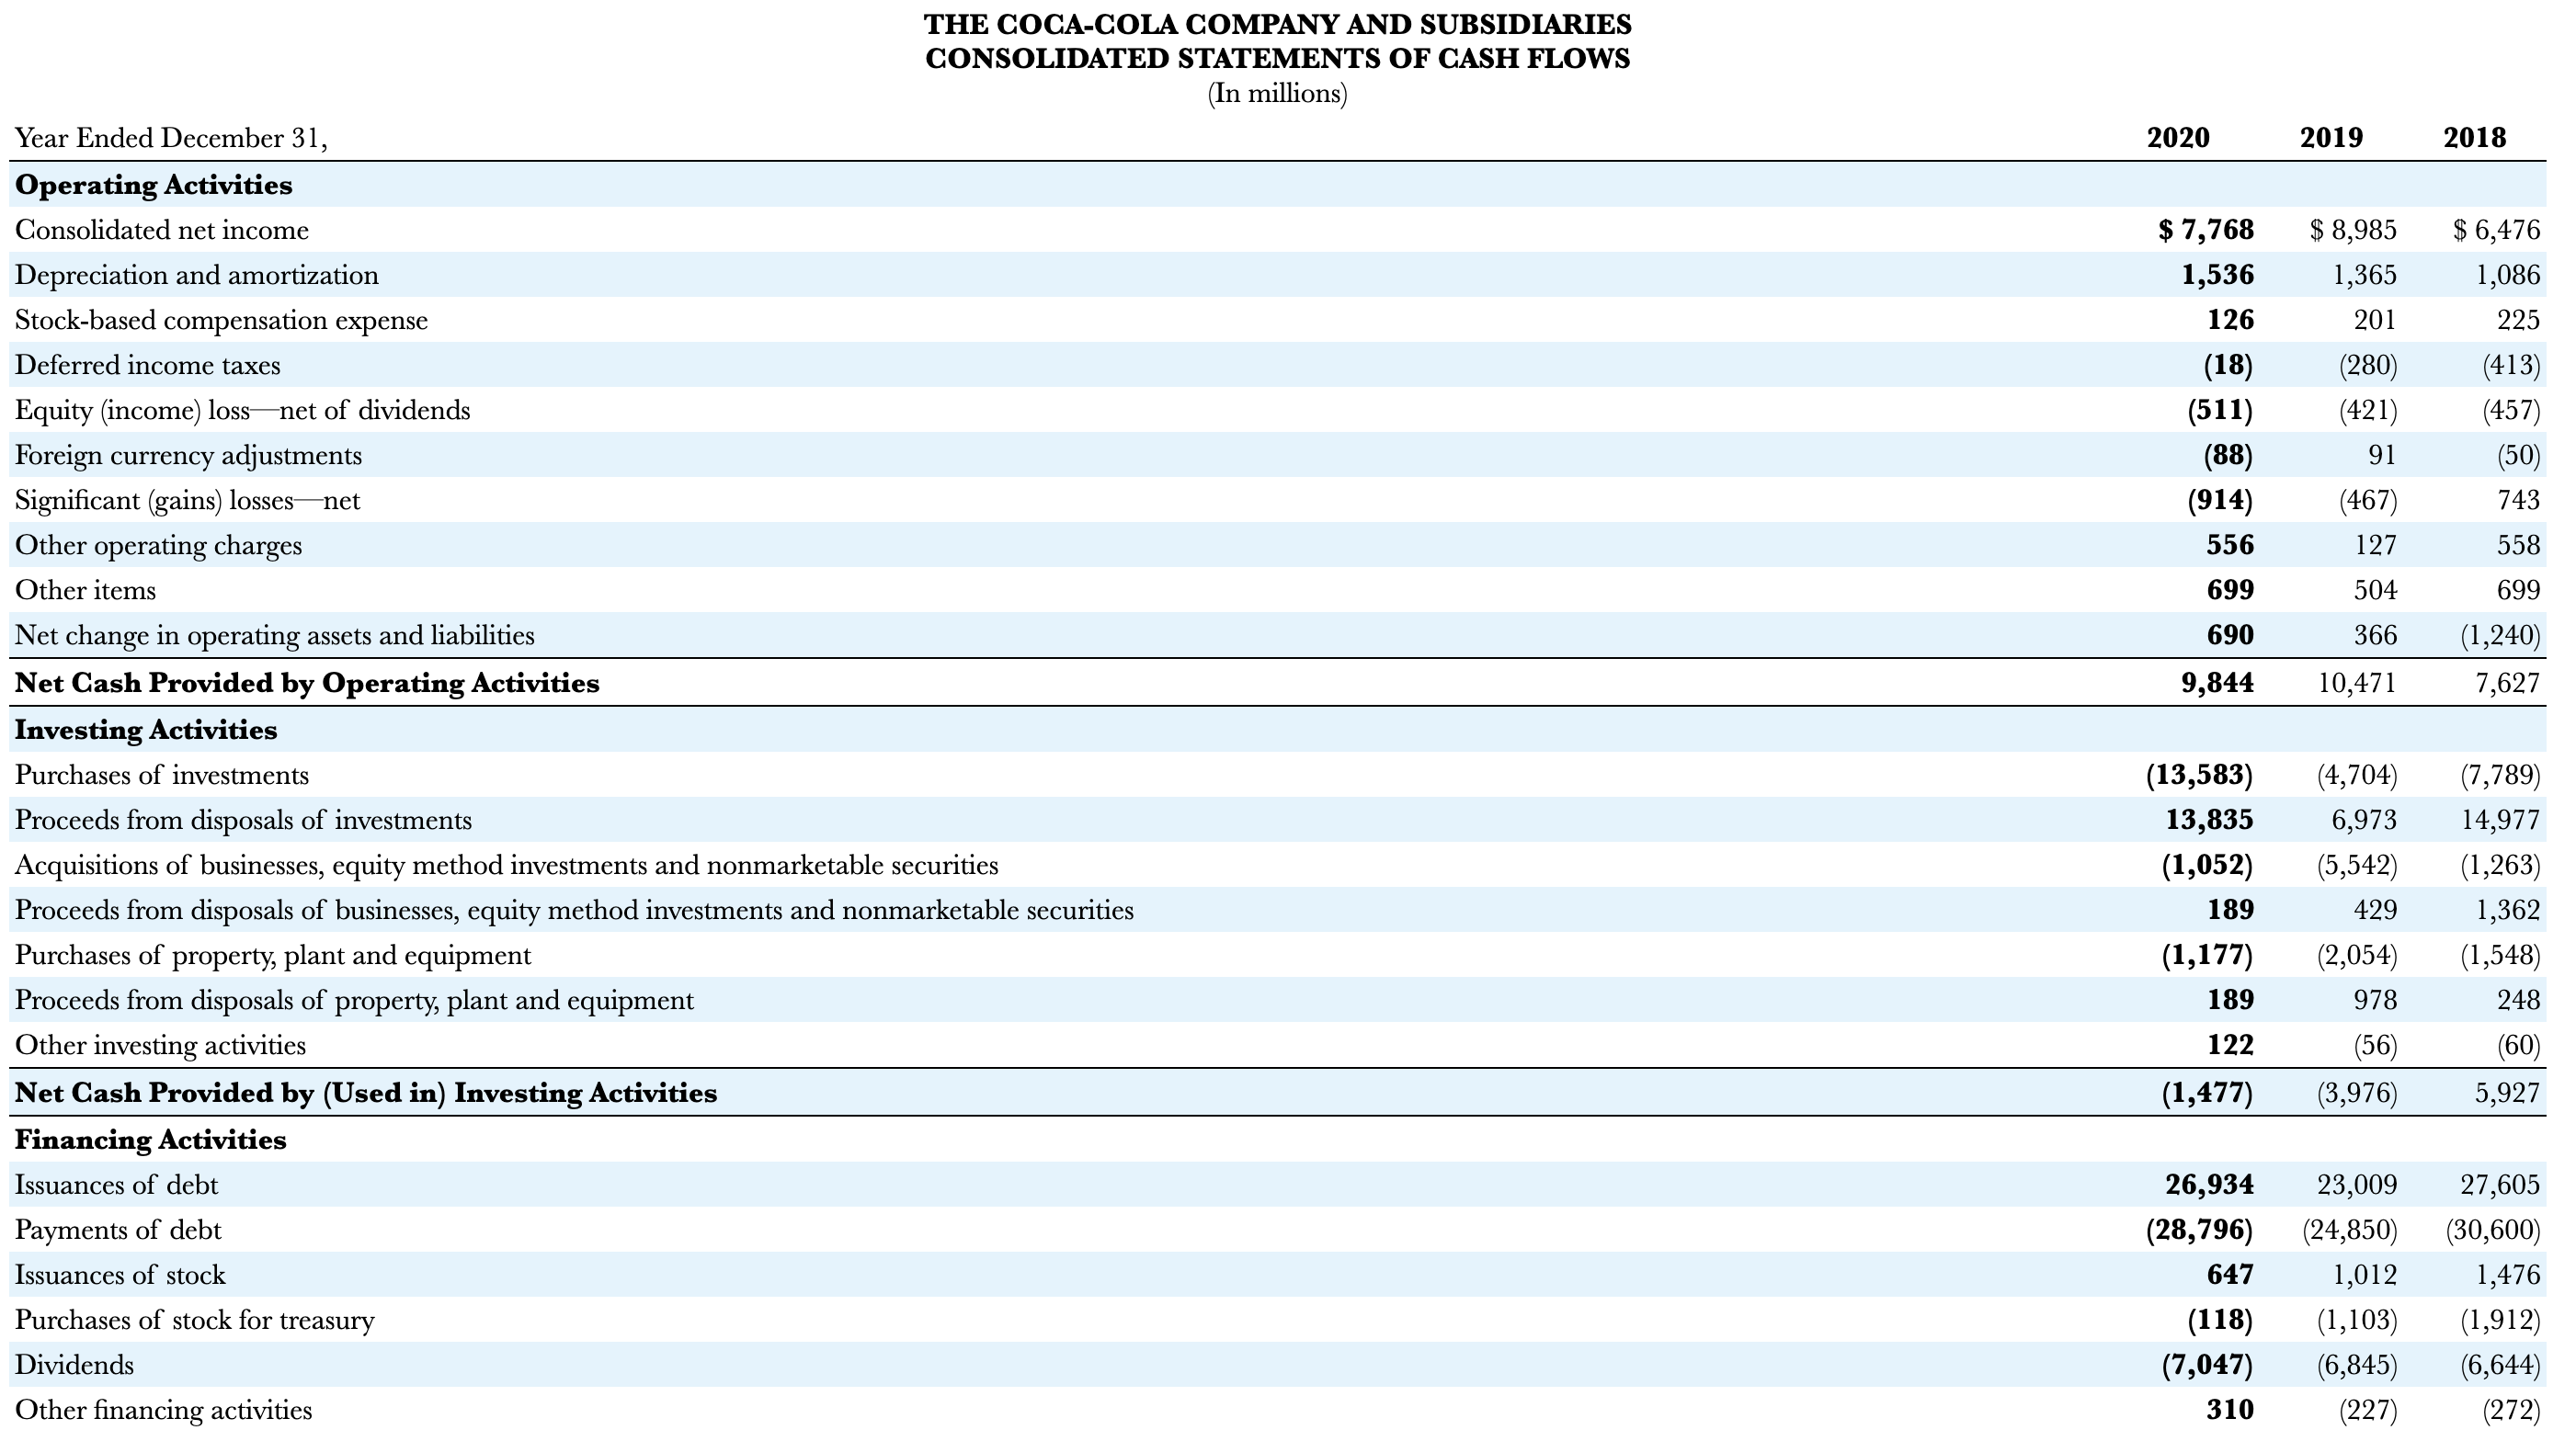
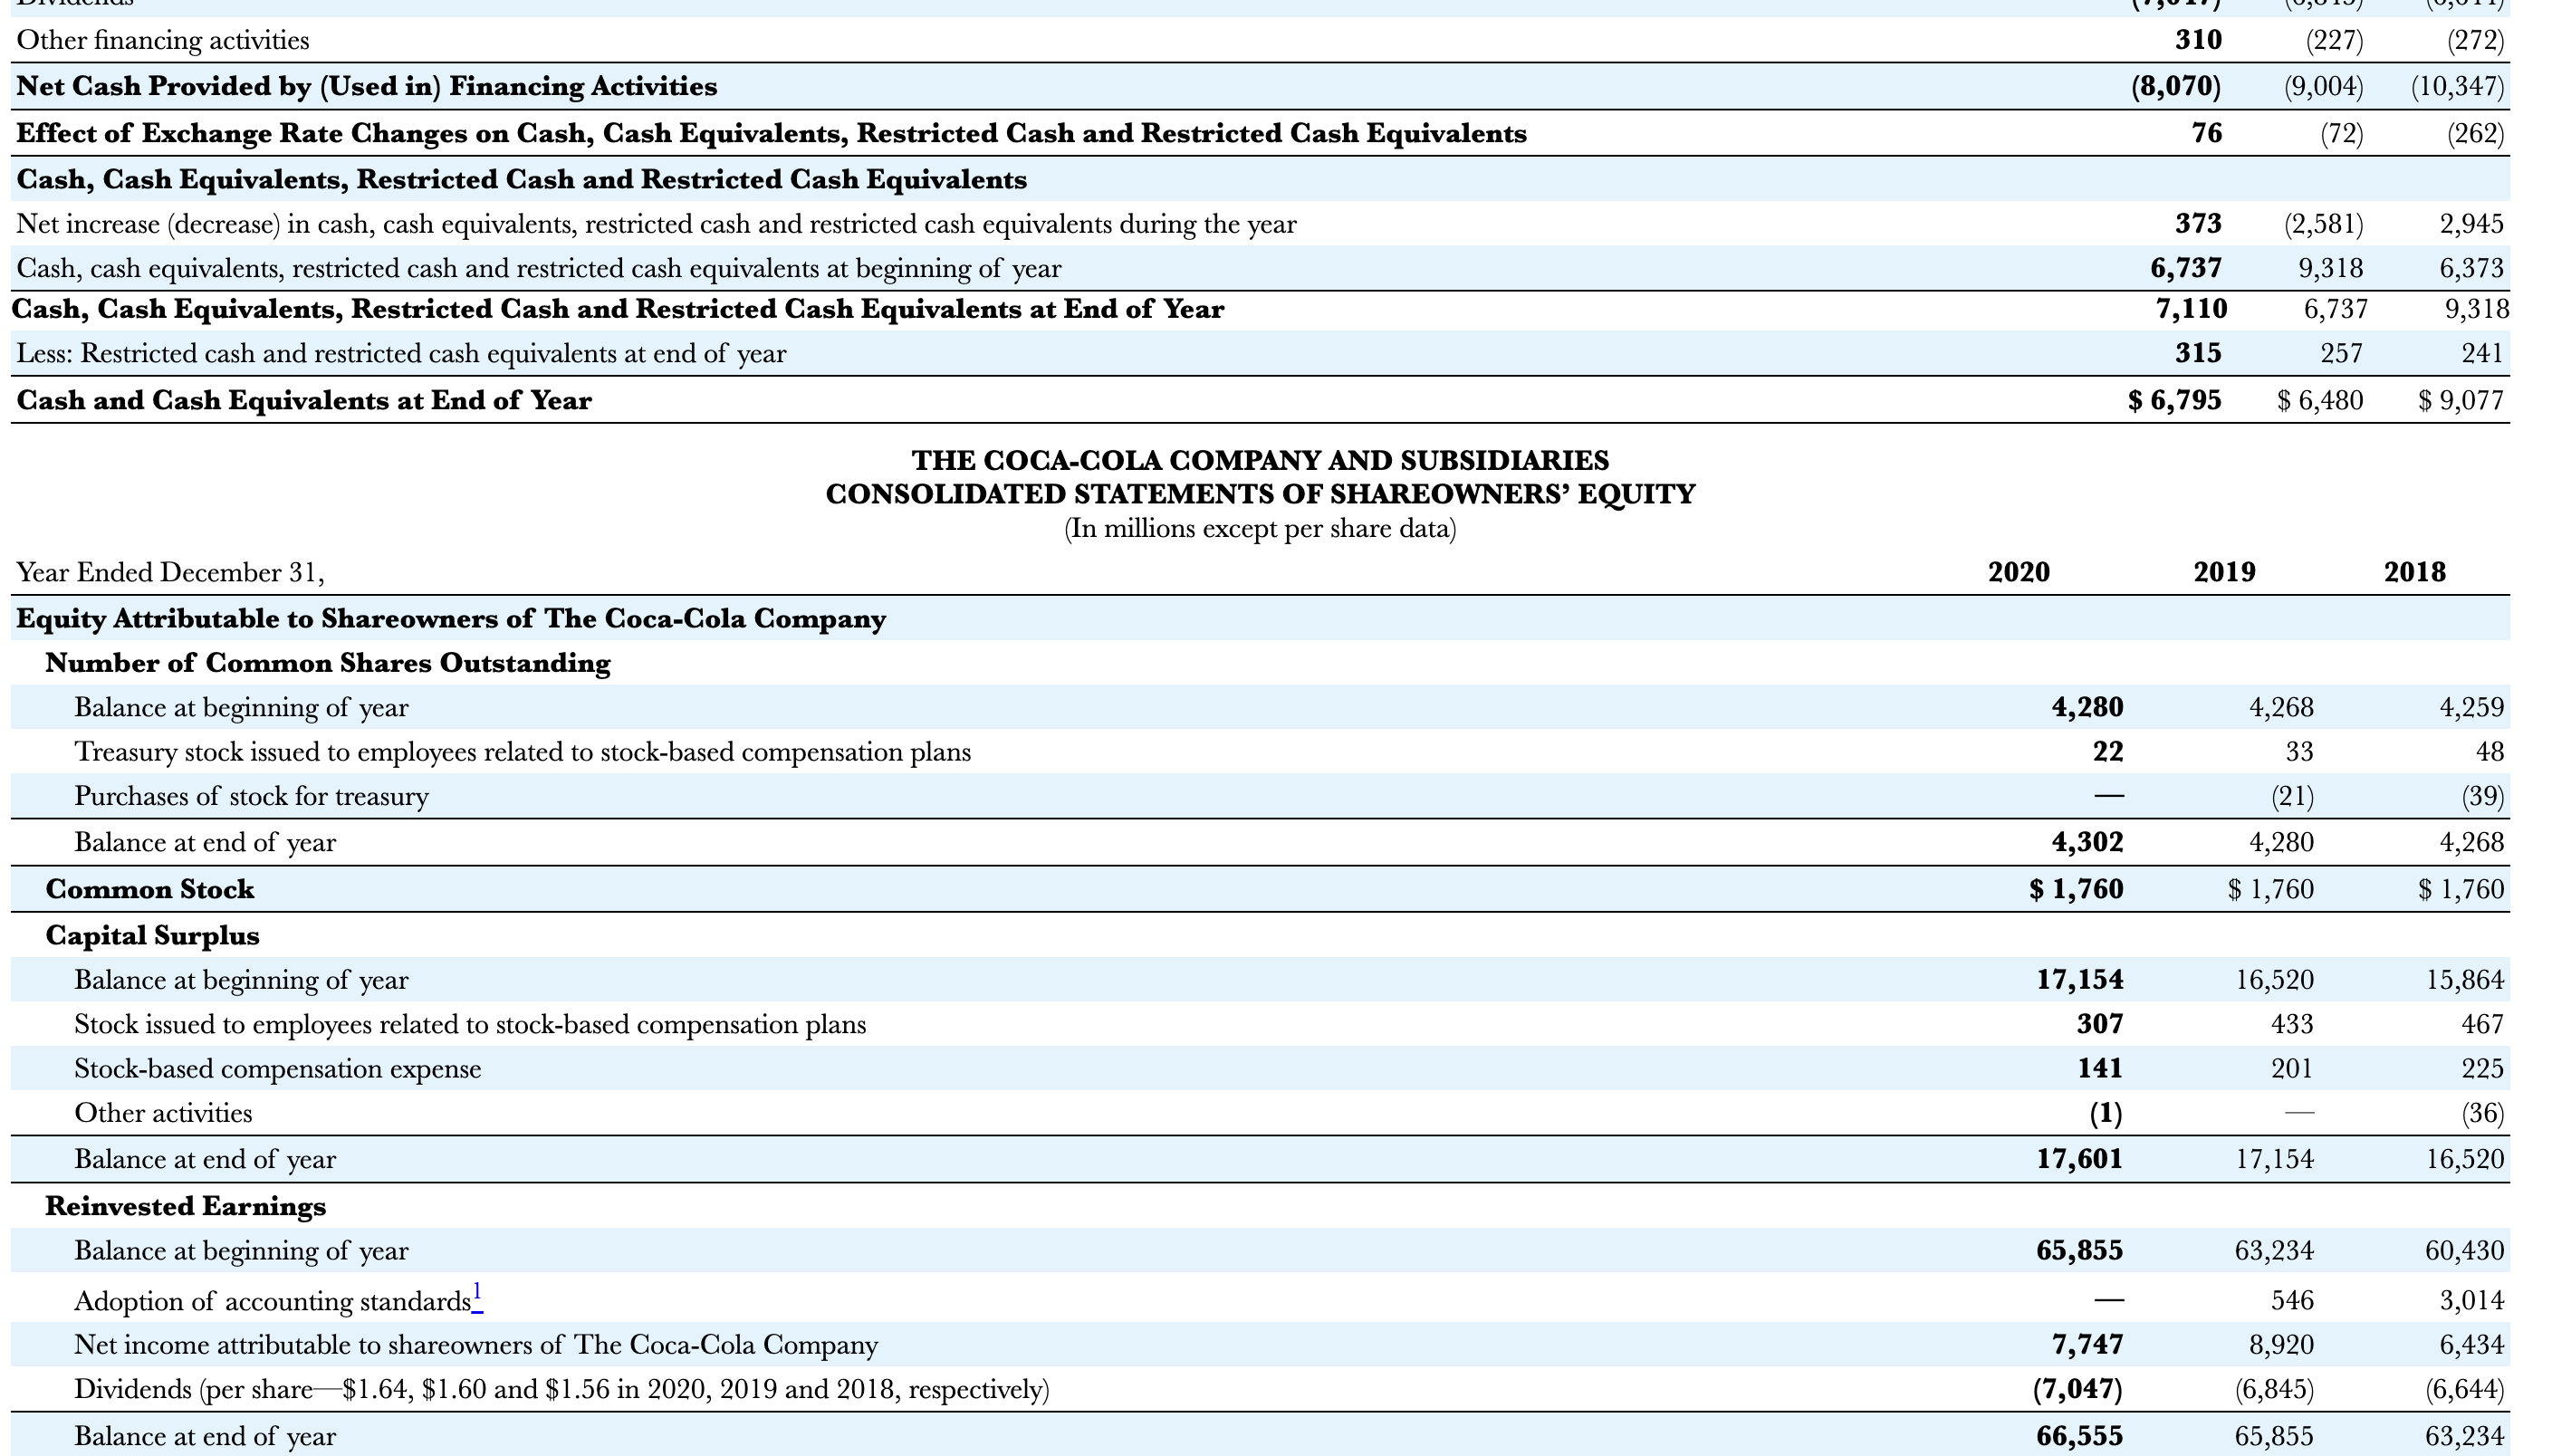
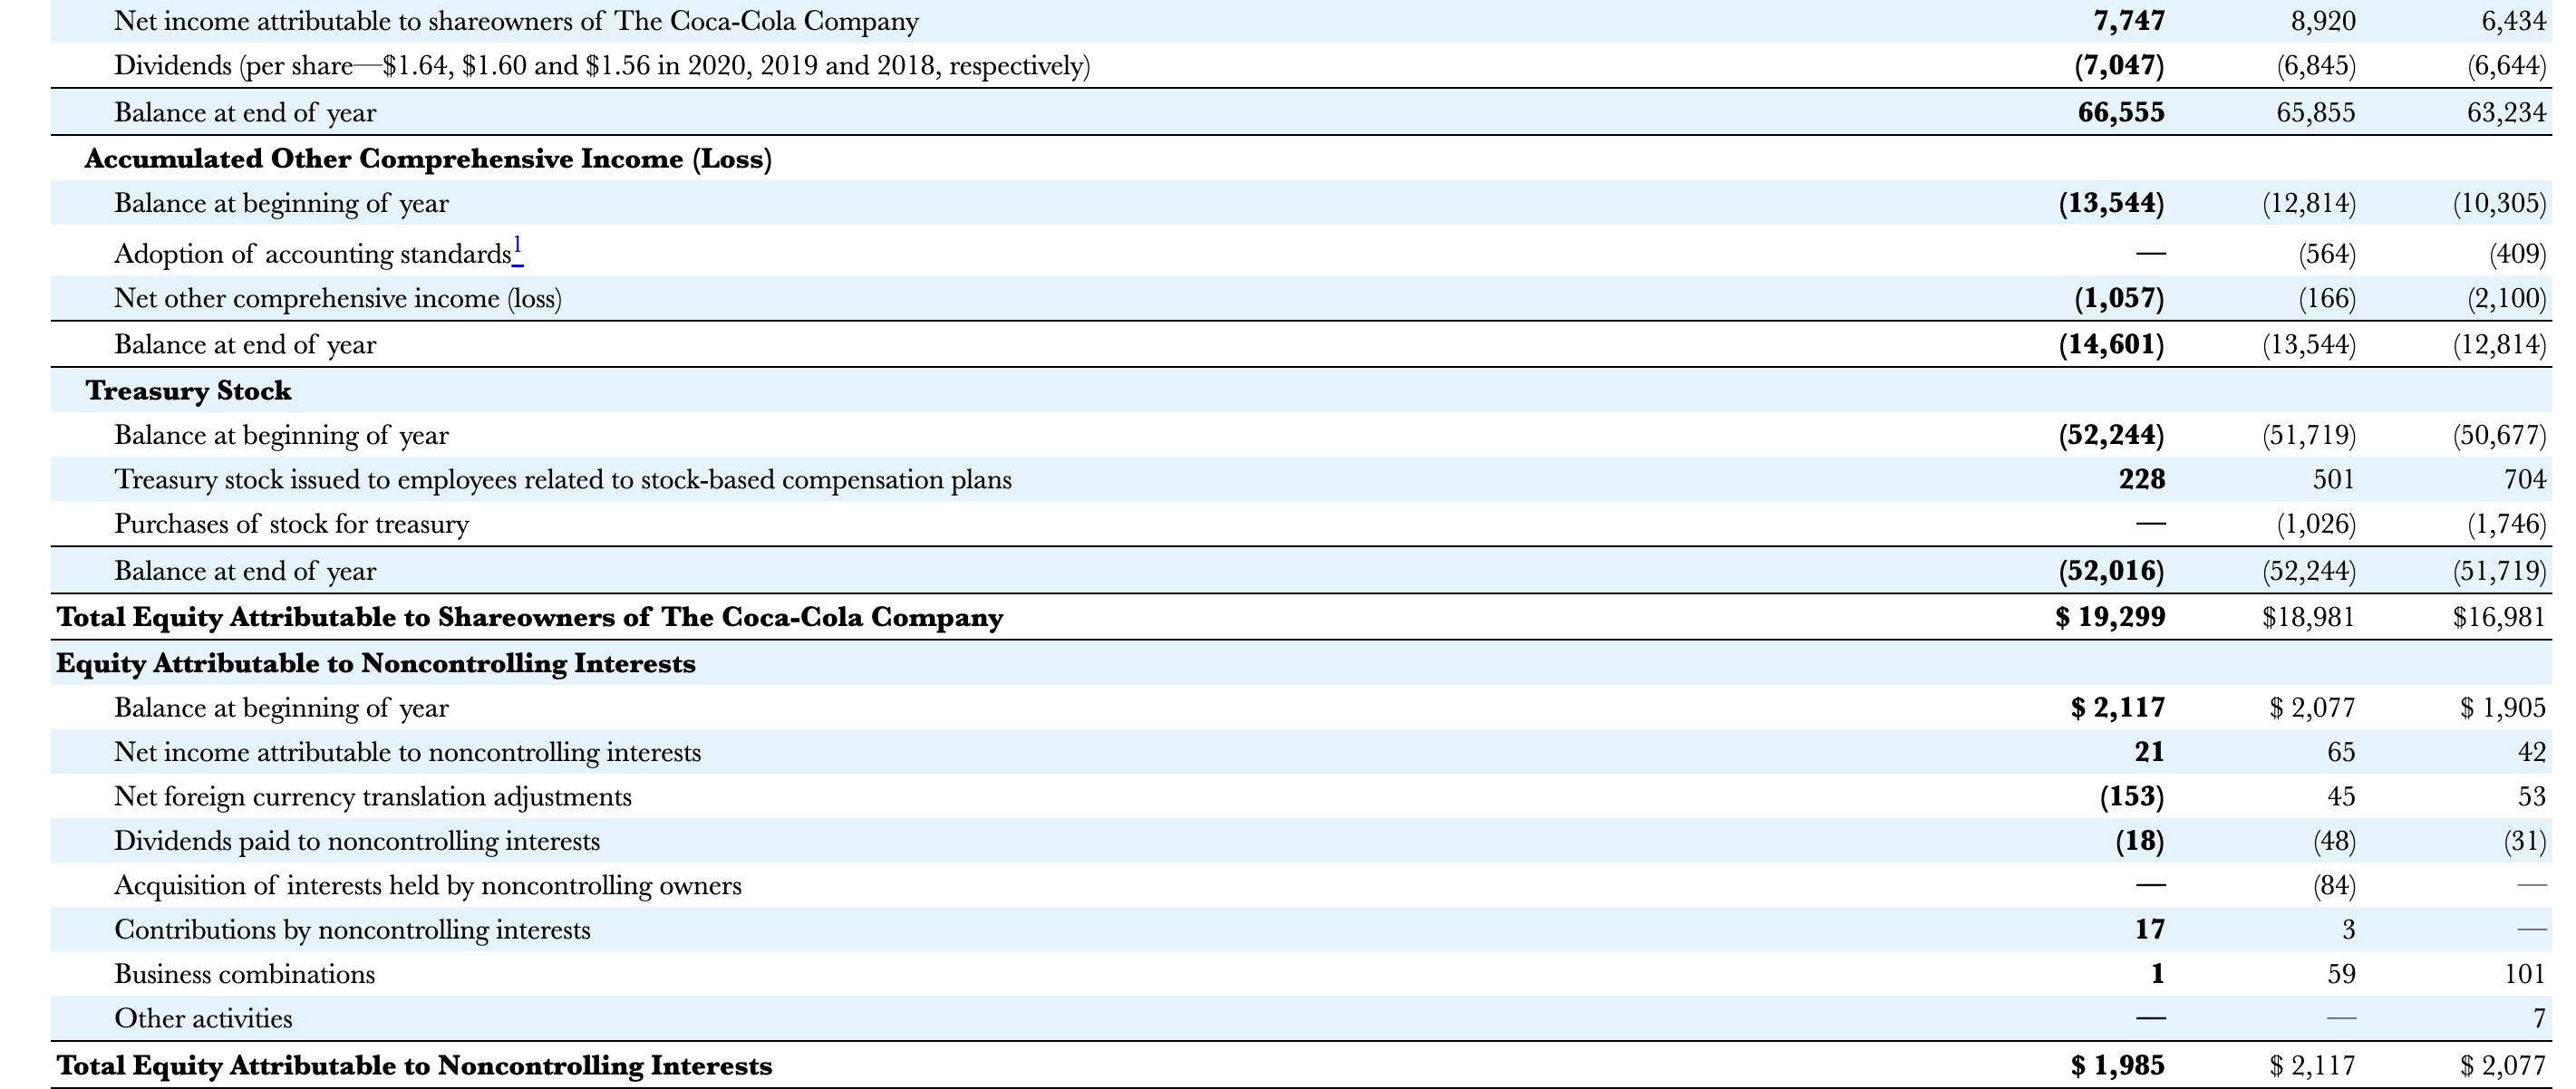
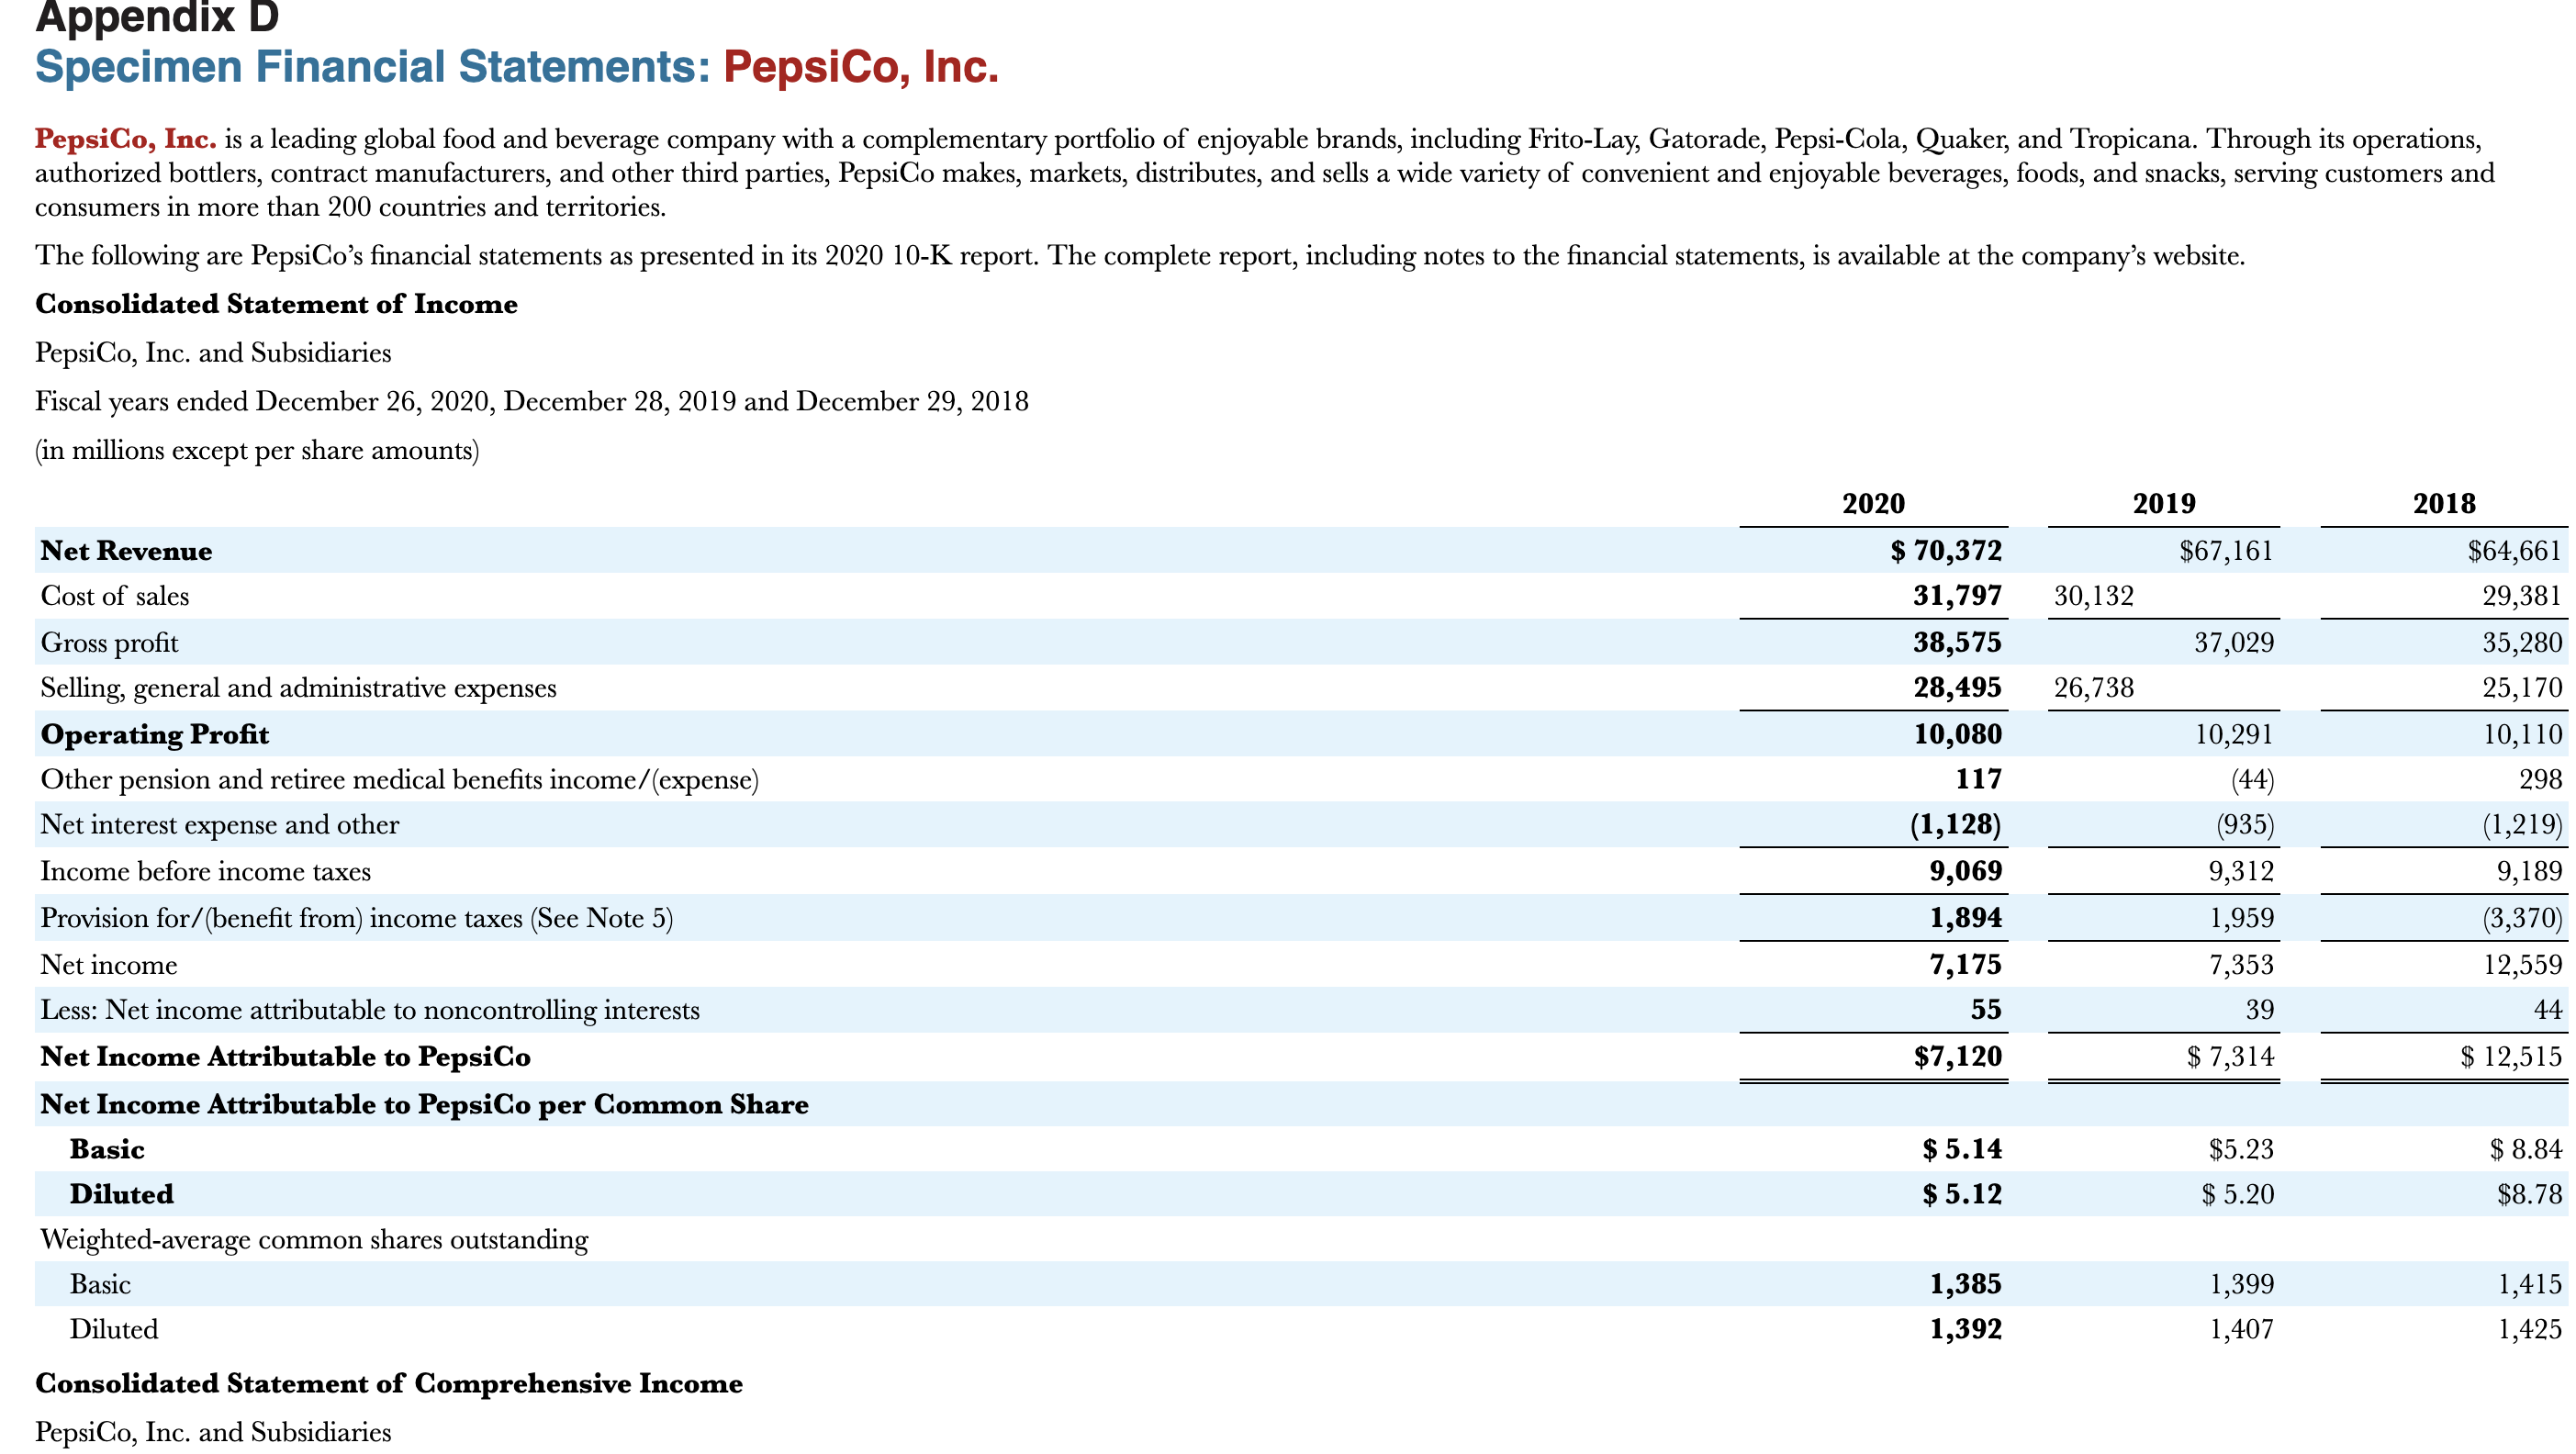
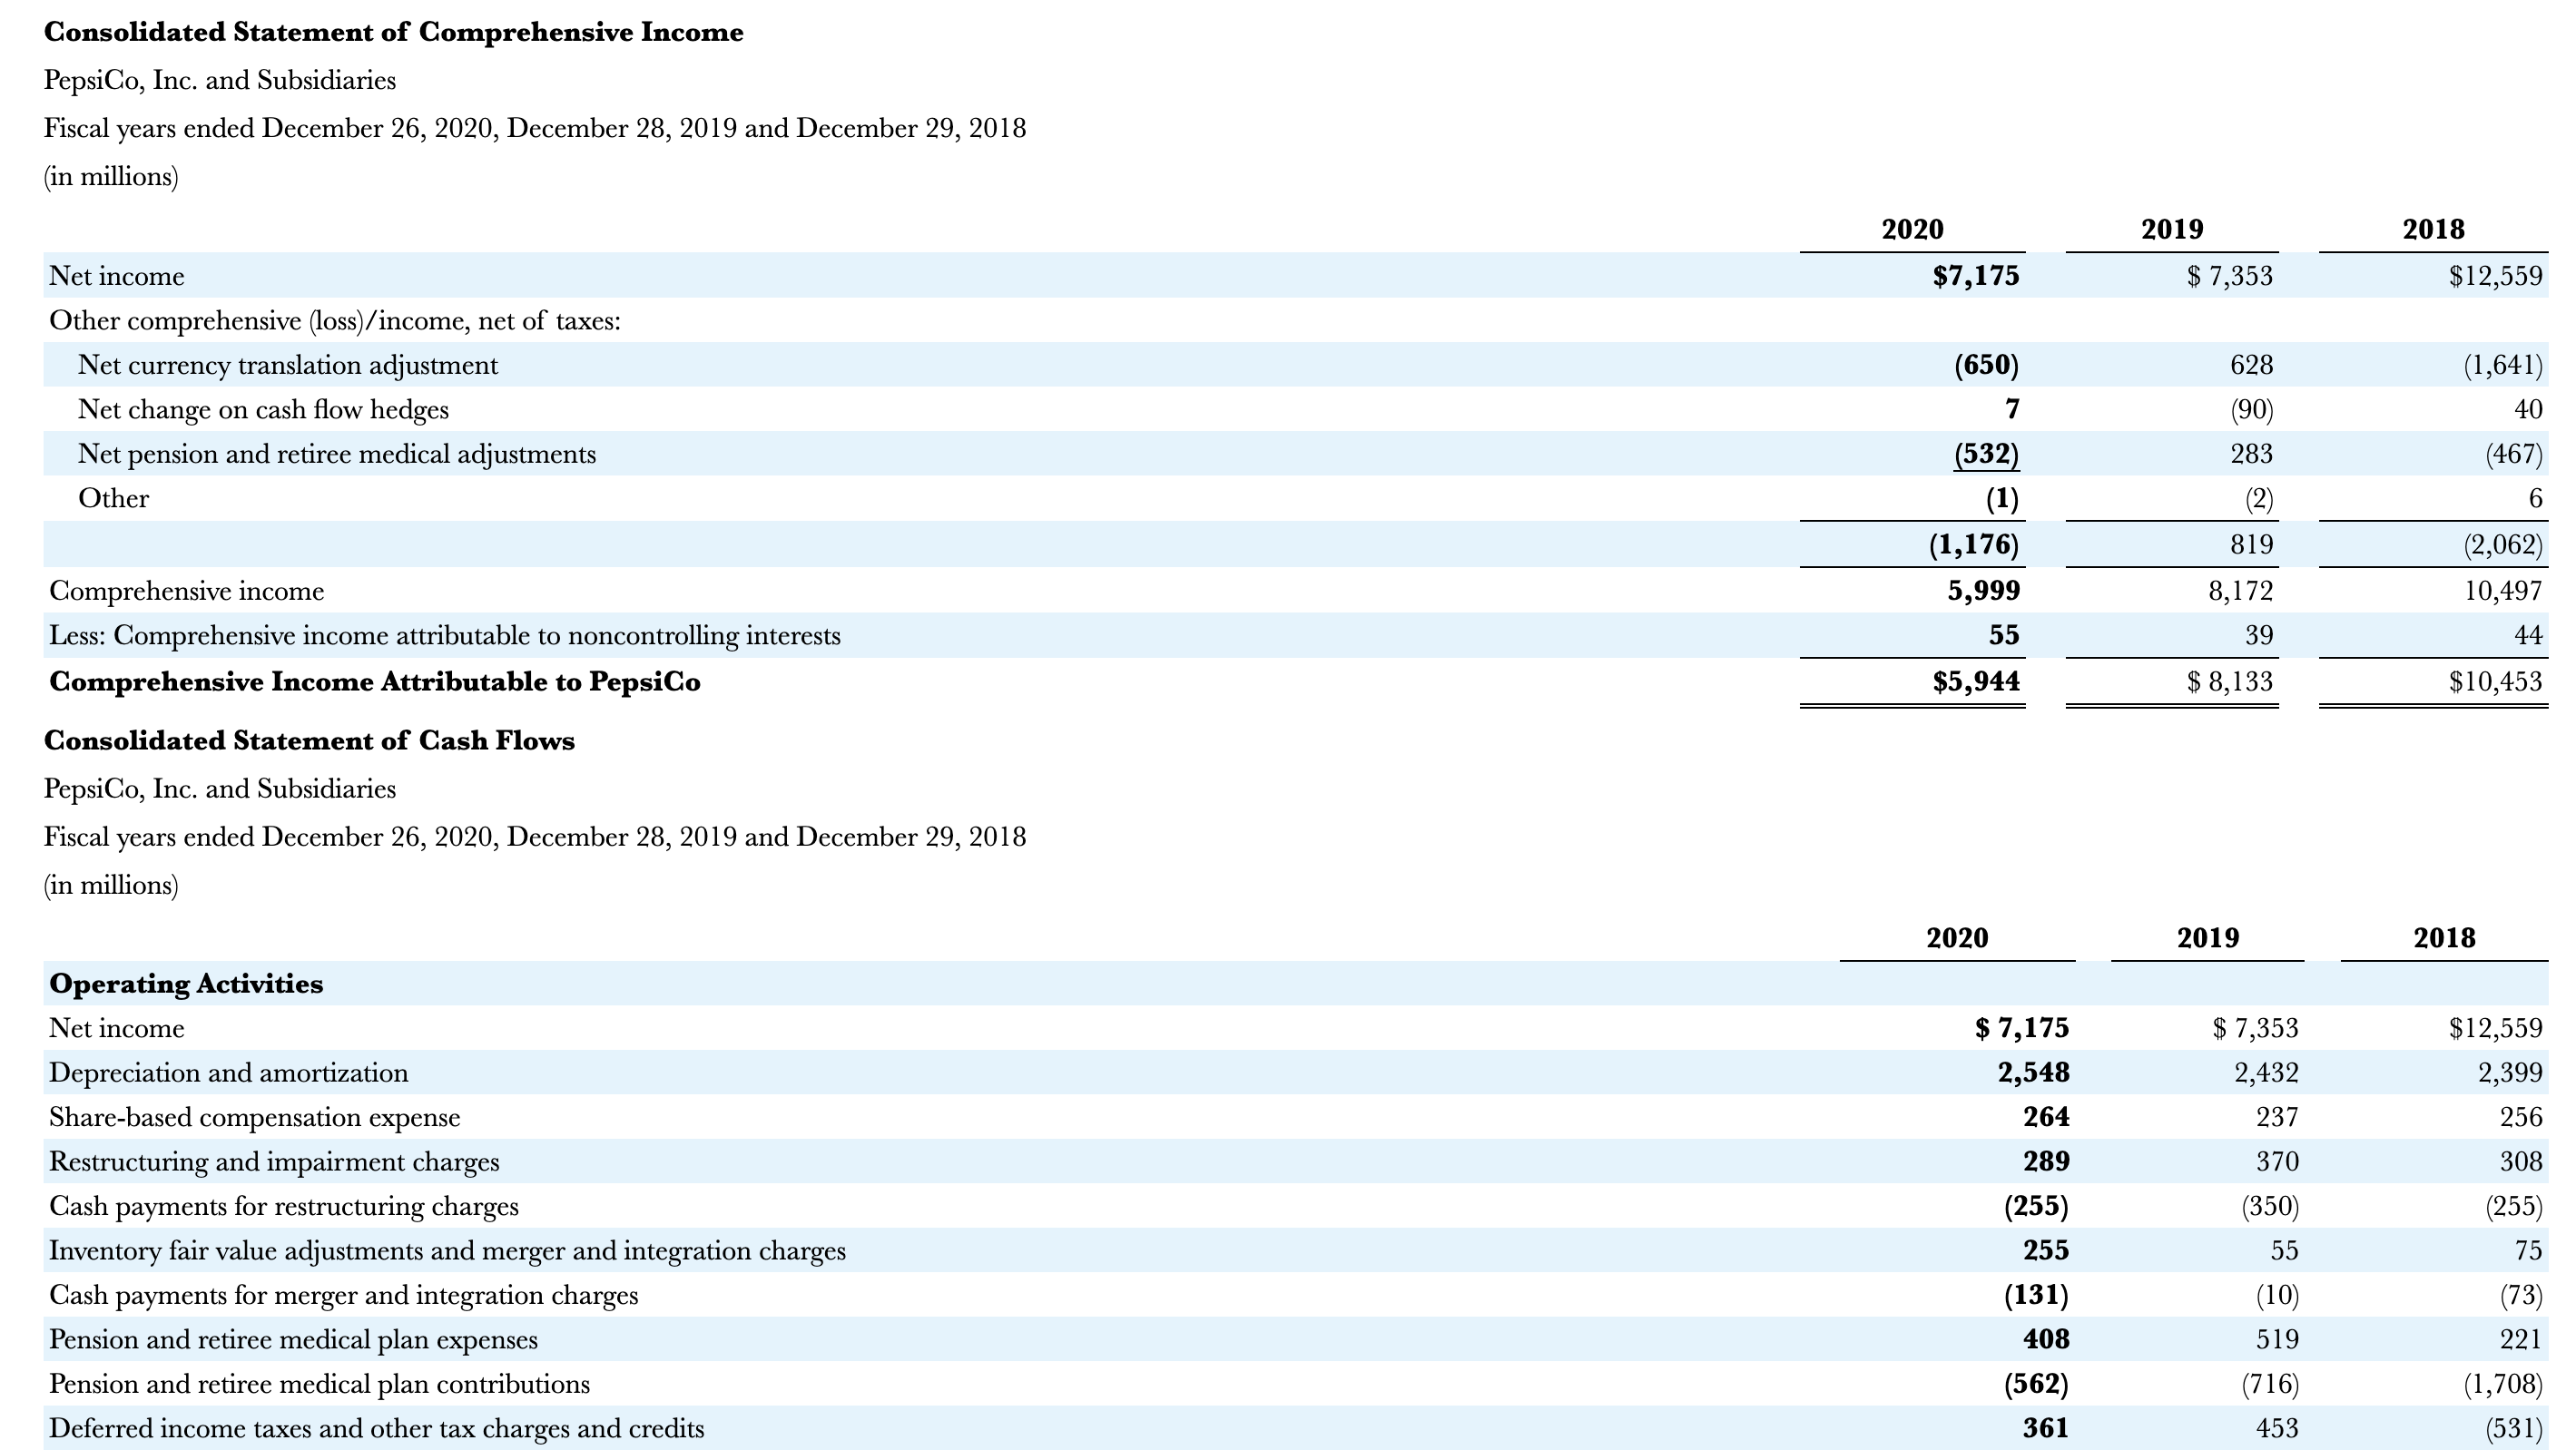
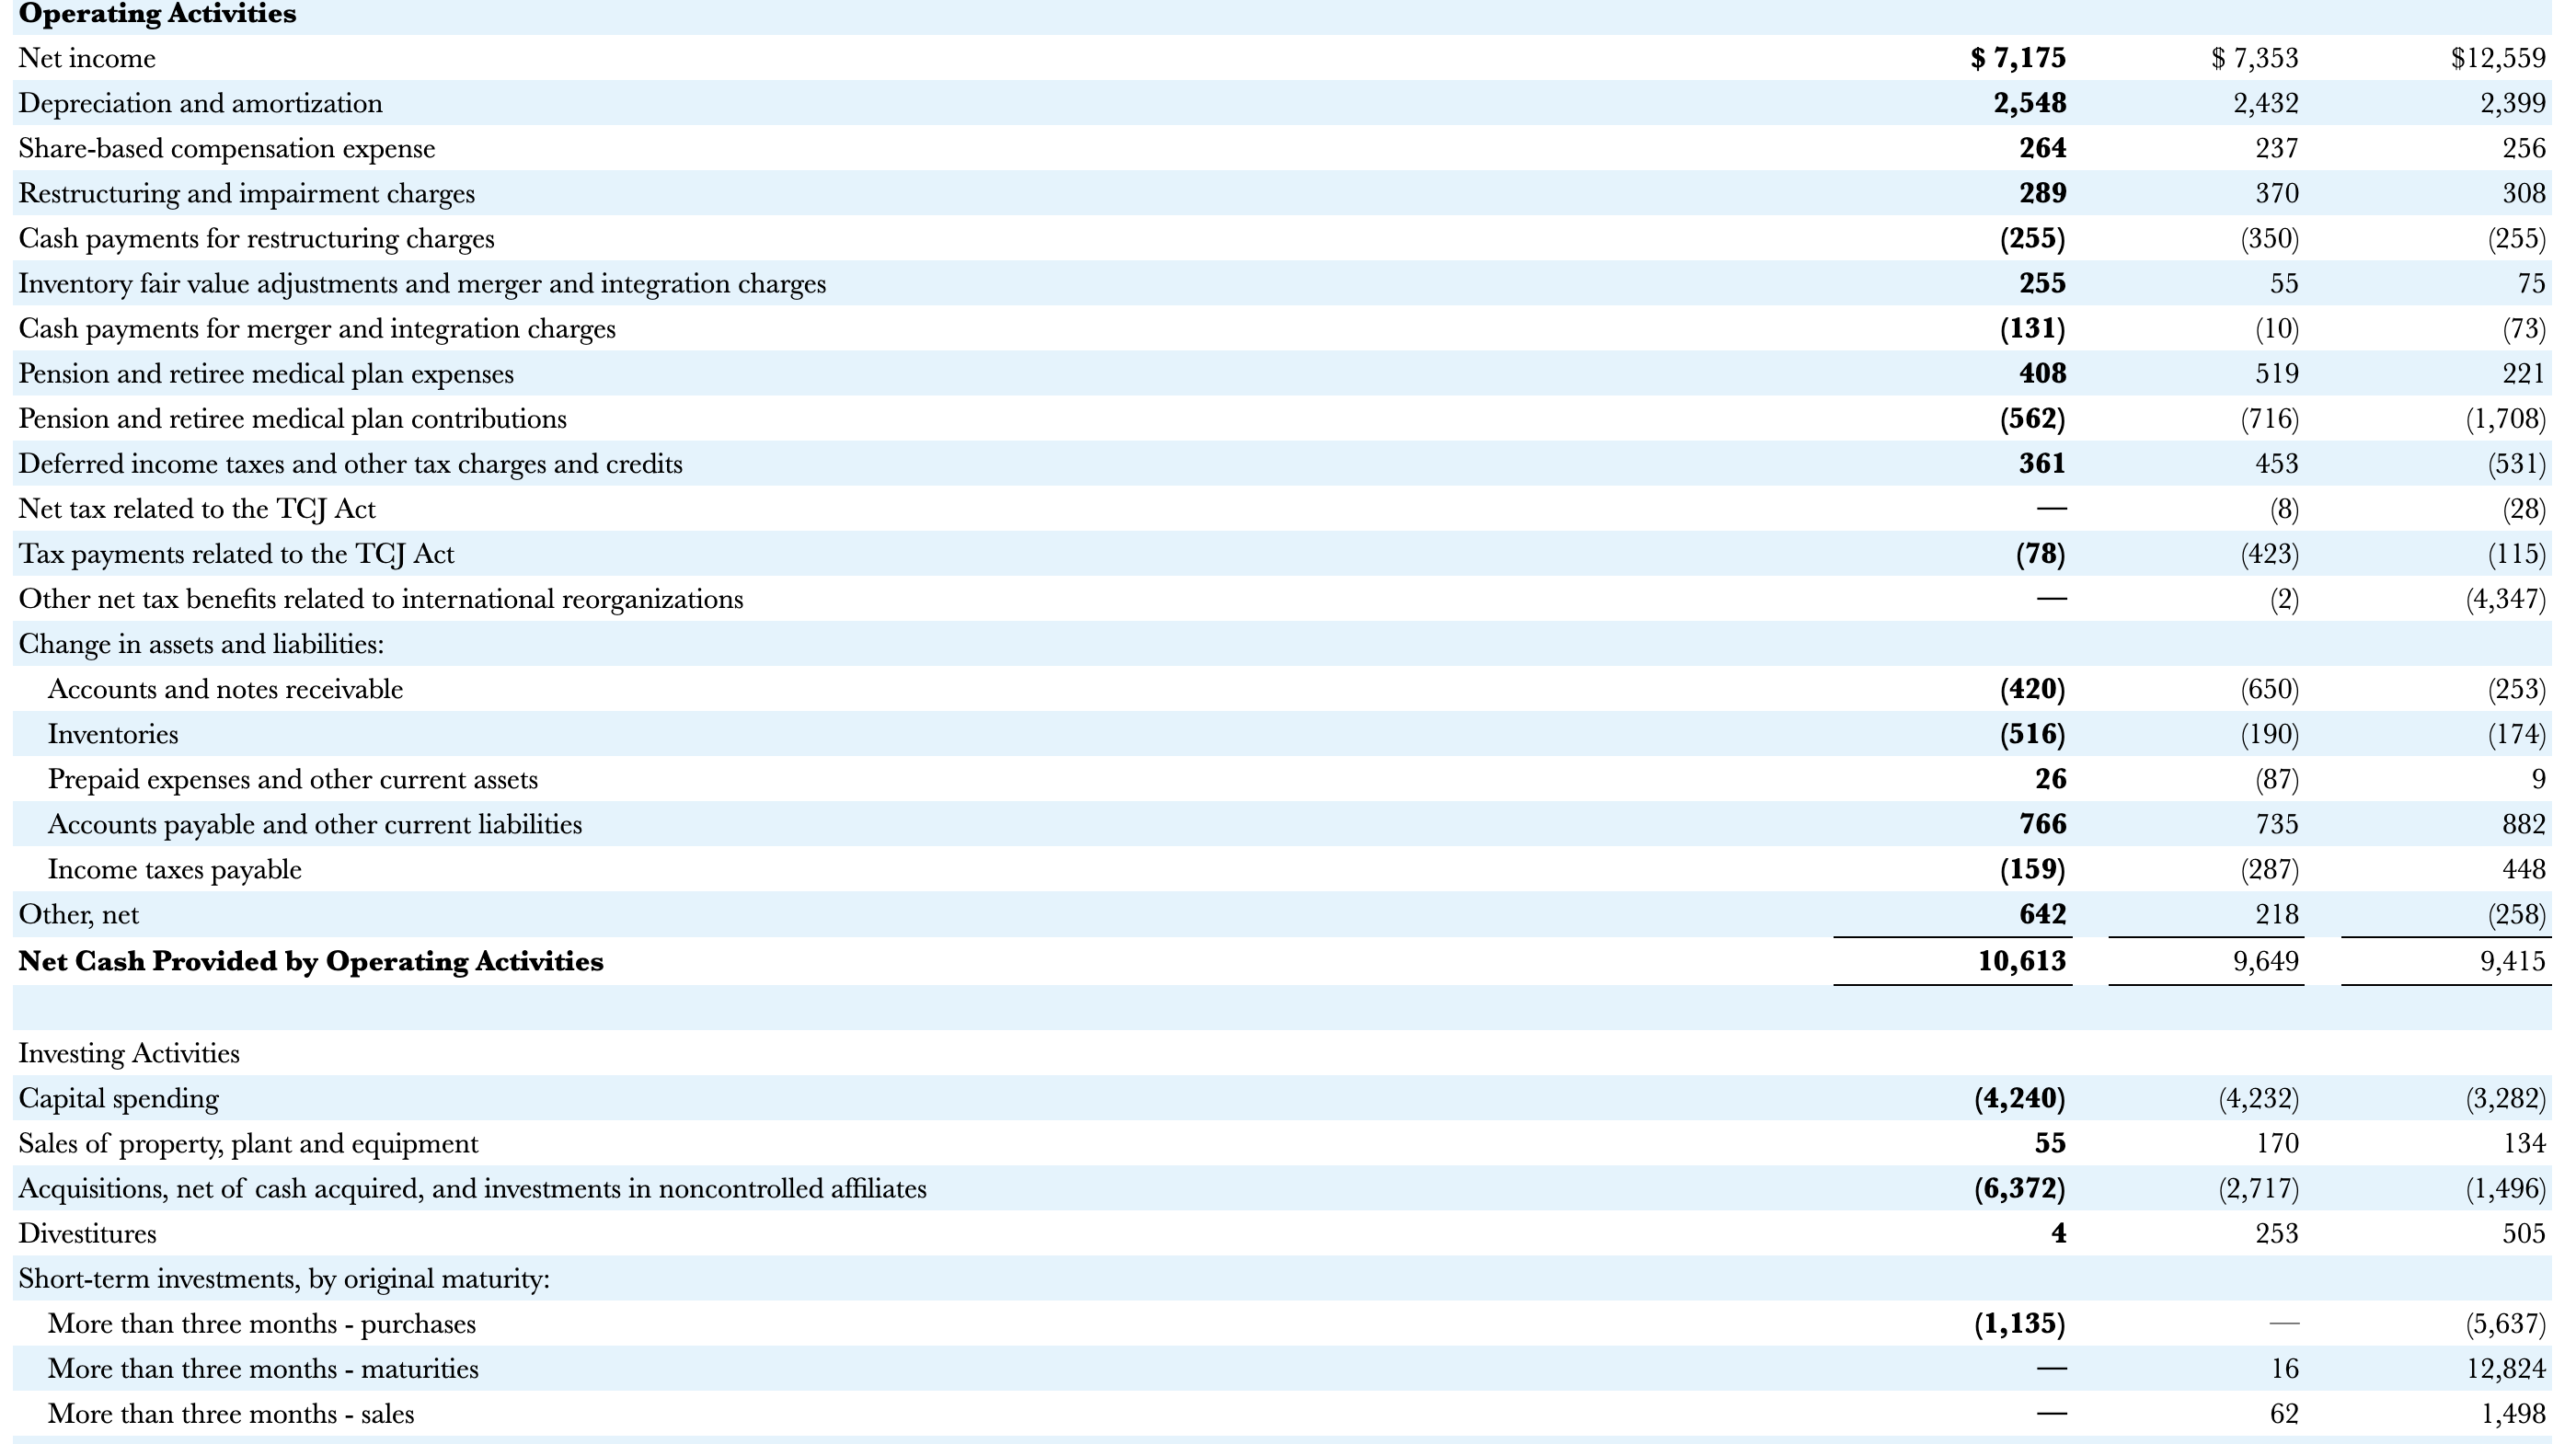
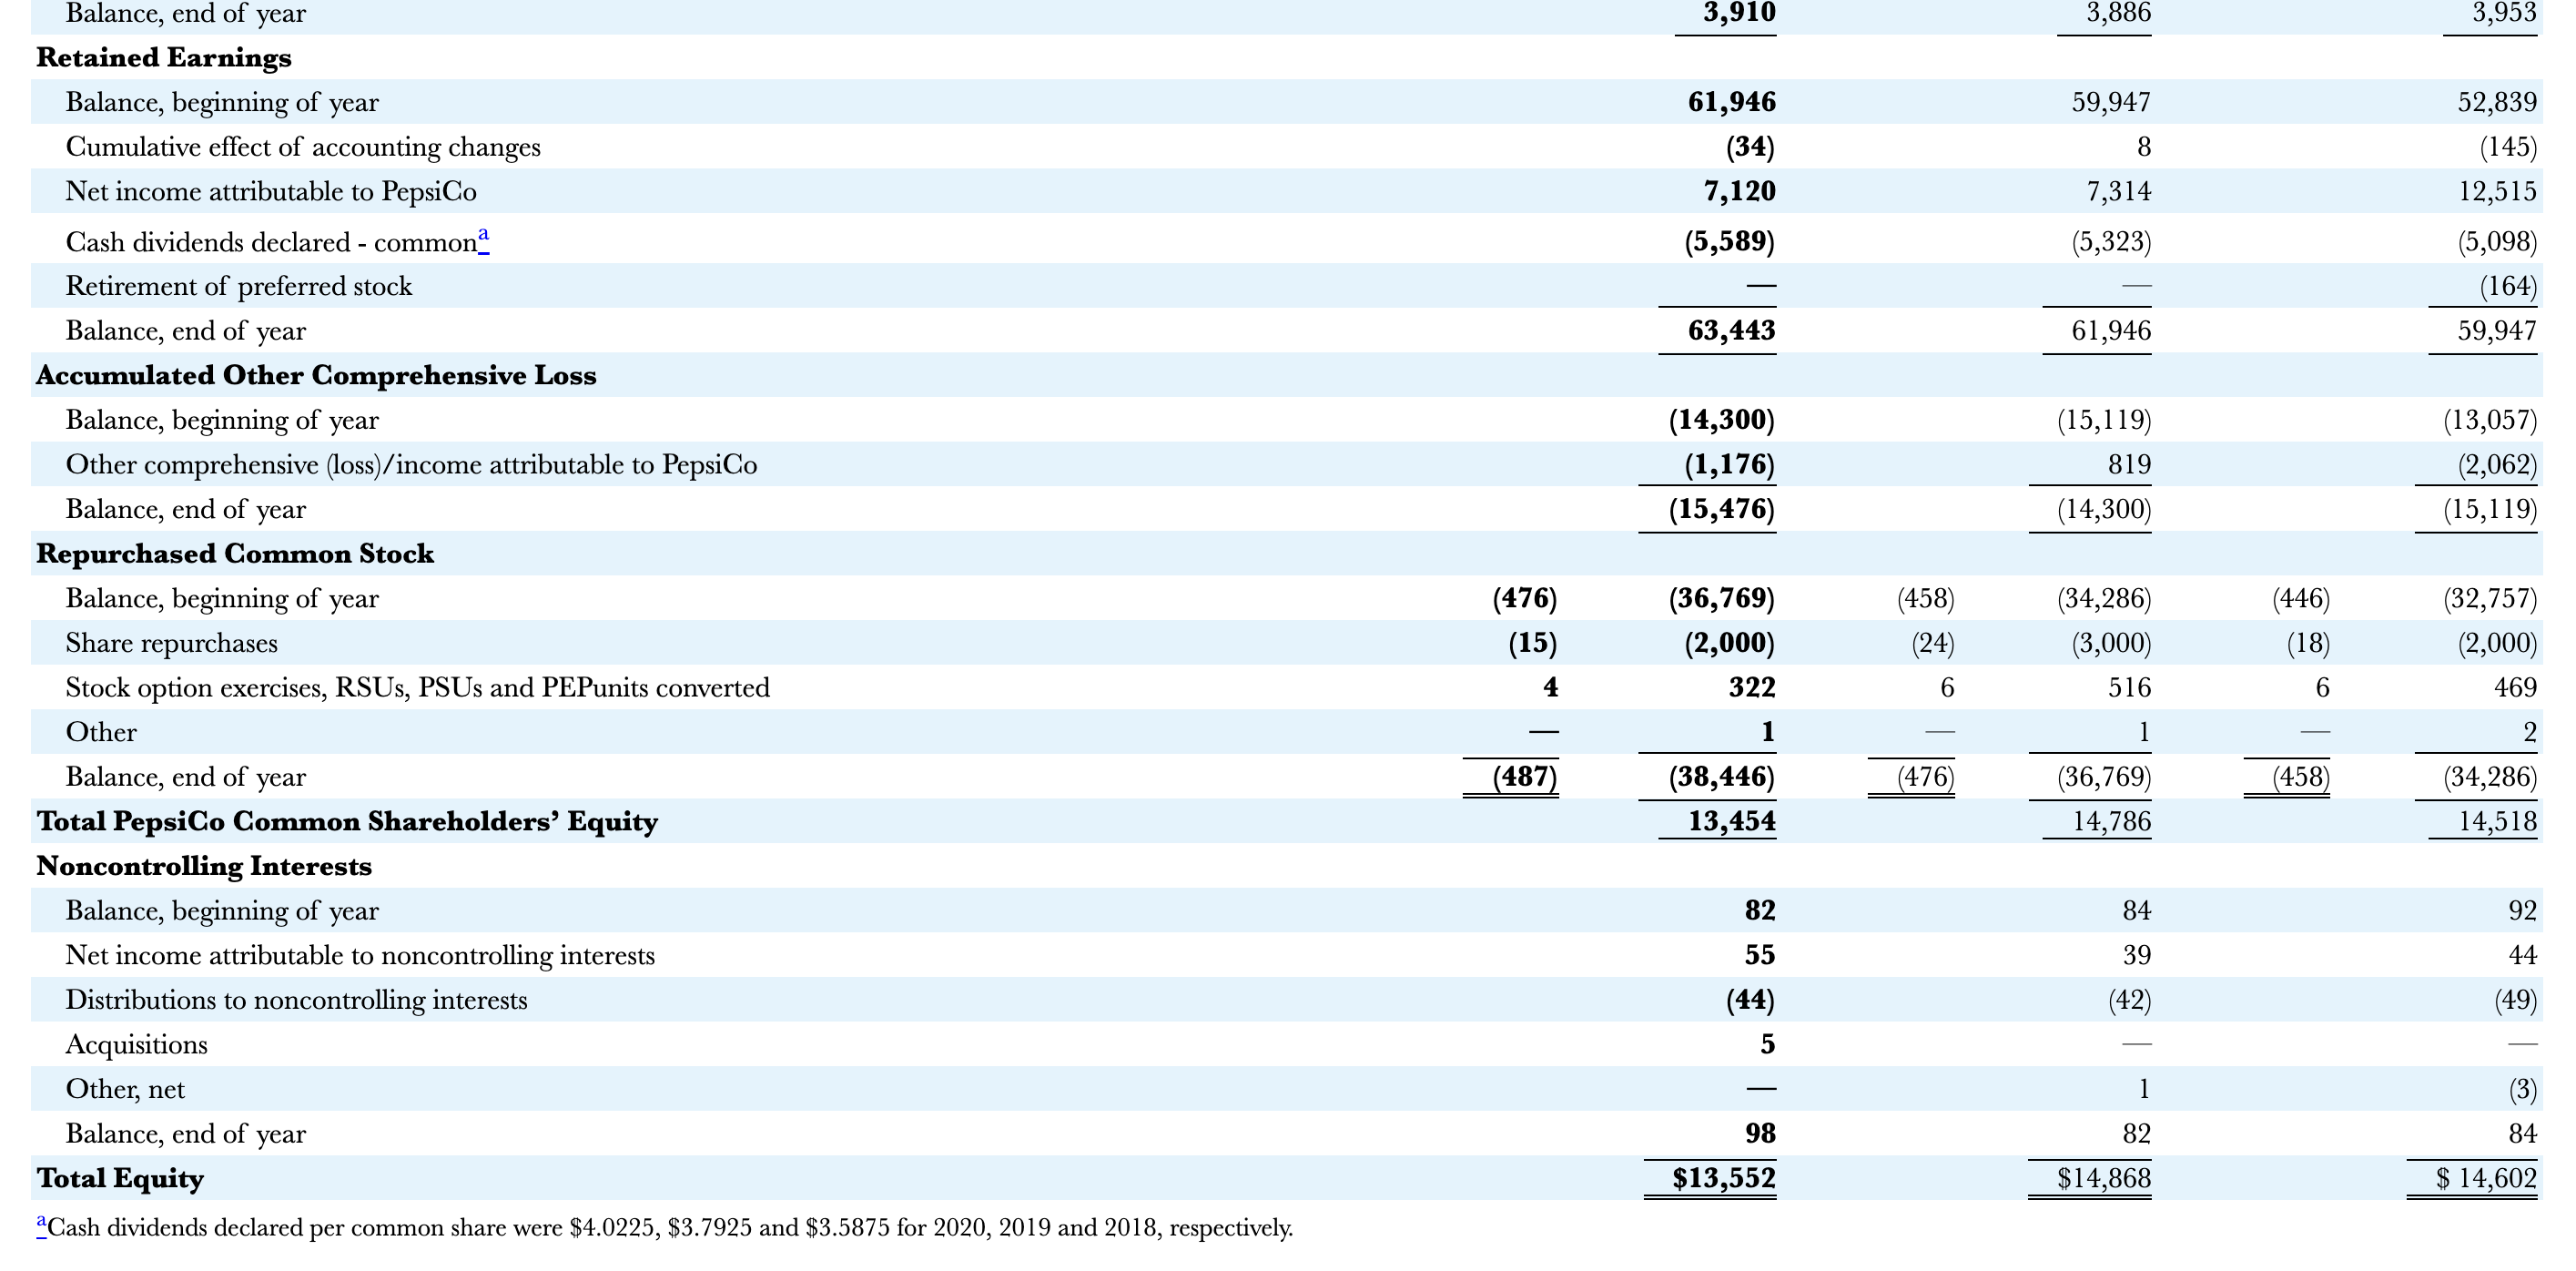
Current Attempt in Progress The financial statement of Coca-Cola are presented in Appendix C. Click here to view Appendix C. The financial statement of PepsiCo are presented in Appendix D. Click here to view Appendix D. The companies' complete annual reports, including the notes to the financial statements, are available online. Use the companies' financial information to answer the following questions. What format(s) did these companies use to present their balance sheets? Coca-Cola Company and PepsiCo, Inc. use th How much working capital did each of these companies have at the end of 2020? (Enter negative amounts using either a negative sign preceding the number e.g. -45 or parentheses e.g. (45).) What are the companies' annual (2019-2020) and 3-year (2018-2020) growth rates in total assets and long-term debt? (Round answers to 2 decimal places, e.g. 52.75\%. Enter negative amounts using either a negative sign preceding the number e.g. 1.45% or parentheses e.g. (1.45)\%.) Compute both companies' (1) current cash debt coverage, (2) cash debt coverage, and (3) free cash flow. (Enter amount in millions. Round ratios to 2 decimal places, e.g. 52.75:1.) Appenalix C Specimen Financial Statements: The Coca-Cola Company are now available in more than 200 countries. THE COGA-COLA COMPANY AND SUBSIDIARIES CONSOLIDATED STATEMENTS OF INGOME (In millions except per share data) _Cialculated based on net income attributable to shareowners of The Cioca-Ciola Ciompany. THE GOCA-COLA COMPANY AND SUBSIDIARIES GONSOLIDATED STATEMENTS OF COMPREHENSIVE INCOME (In millions) \begin{tabular}{|c|c|c|} \hline Year Ended December 31, & 2020 & 2018 \\ \hline Gonsolidated Net Income & $7,768 & $6,476 \\ \hline \multicolumn{3}{|l|}{ Other Comprehensive Income: } \\ \hline Net foreign currency translation adjustments & (911) & (2,035) \\ \hline Net gains (losses) on derivatives & (54) & (7) \\ \hline Net change in unrealized gains (losses) on available-for-sale debt securities & (47) & (34) \\ \hline Net change in pension and other postretirement benefit liabilities & (267) & 29 \\ \hline Total Comprehensive Income & 6,558 & 4,429 \\ \hline Less: Comprehensive income attributable to noncontrolling interests & (132) & 95 \\ \hline Total Comprehensive Income Attributable to Shareowners of The Coca-Cola Company & $6,690 & $4,334 \\ \hline \begin{tabular}{r} THE COCA-COLA CO \\ CON million \end{tabular} & & \\ \hline December 31 , & 2020 & 2019 \\ \hline \multicolumn{3}{|c|}{ ASSETS } \\ \hline \multicolumn{3}{|l|}{ Gurrent Assets } \\ \hline Cash and cash equivalents & $6,795 & $6,480 \\ \hline Short-term investments & 1,771 & 1,467 \\ \hline Total Cash, Cash Equivalents and Short-Term Investments & 8,566 & 7,947 \\ \hline Marketable securities & 2,348 & 3,228 \\ \hline Trade accounts receivable, less allowances of $526 and $524, respectively & 3,144 & 3,971 \\ \hline Inventories & 3,266 & 3,379 \\ \hline Prepaid expenses and other assets & 1,916 & 1,886 \\ \hline Total Gurrent Assets & 19,240 & 20,411 \\ \hline Equity method investments & 19,273 & 19,025 \\ \hline Other investments & 812 & 854 \\ \hline Other assets & 6,184 & 6,075 \\ \hline Deferred income tax assets & 2,460 & 2,412 \\ \hline \end{tabular} \begin{tabular}{|c|c|c|} \hline Deferred income tax assets & 2,460 & 2,412 \\ \hline Property, plant and equipment - net & 10,777 & 10,838 \\ \hline Trademarks with indefinite lives & 10,395 & 9,266 \\ \hline Goodwill & 17,506 & 16,764 \\ \hline Other intangible assets & 649 & 736 \\ \hline Total Assets & $87,296 & $86,381 \\ \hline \multicolumn{3}{|c|}{ LIABILITIES AND EQUITY } \\ \hline \multicolumn{3}{|l|}{ Gurrent Liabilities } \\ \hline Accounts payable and accrued expenses & $11,145 & $11,312 \\ \hline Loans and notes payable & 2,183 & 10,994 \\ \hline Current maturities of long-term debt & 485 & 4,253 \\ \hline Accrued income taxes & 788 & 414 \\ \hline Total Current Liabilities & 14,601 & 26,973 \\ \hline Long-term debt & 40,125 & 27,516 \\ \hline Other liabilities & 9,453 & 8,510 \\ \hline Deferred income tax liabilities & 1,833 & 2,284 \\ \hline \multicolumn{3}{|l|}{ The Coca-Cola Company Shareowners' Equity } \\ \hline Common stock, $0.25 par value; authorized 11,200 shares; issued 7,040 shares & 1,760 & 1,760 \\ \hline Capital surplus & 17,601 & 17,154 \\ \hline Reinvested earnings & 66,555 & 65,855 \\ \hline Accumulated other comprehensive income (loss) & (14,601) & (13,544) \\ \hline Treasury stock, at cost 2,738 and 2,760 shares, respectively & (52,016) & (52,244) \\ \hline Equity Attributable to Shareowners of The Coca-Cola Company & 19,299 & 18,981 \\ \hline Equity attributable to noncontrolling interests & 1,985 & 2,117 \\ \hline Total Equity & 21,284 & 21,098 \\ \hline Total Liabilities and Equity & $87,296 & $86,381 \\ \hline \end{tabular} THE GOCA-GOLA COMPANY AND SUBSIDIARIES GONSOLIDATED STATEMENTS OF GASH FLOWS (In millions) \begin{tabular}{|c|c|c|c|} \hline Year Ended December 31, & 2020 & 2019 & 2018 \\ \hline \multicolumn{4}{|l|}{ Operating Activities } \\ \hline Consolidated net income & $7,768 & $8,985 & $6,476 \\ \hline Depreciation and amortization & 1,536 & 1,365 & 1,086 \\ \hline Stock-based compensation expense & 126 & 201 & 225 \\ \hline Deferred income taxes & (18) & (280) & (413) \\ \hline Equity (income) loss - net of dividends & (511) & (421) & (457) \\ \hline Foreign currency adjustments & (88) & 91 & (50) \\ \hline Significant (gains) losses - net & (914) & (467) & 743 \\ \hline Other operating charges & 556 & 127 & 558 \\ \hline Other items & 699 & 504 & 699 \\ \hline Net change in operating assets and liabilities & 690 & 366 & (1,240) \\ \hline Net Cash Provided by Operating Activities & 9,844 & 10,471 & 7,627 \\ \hline \multicolumn{4}{|l|}{ Investing Activities } \\ \hline Purchases of investments & (13,583) & (4,704) & (7,789) \\ \hline Proceeds from disposals of investments & 13,835 & 6,973 & 14,977 \\ \hline Acquisitions of businesses, equity method investments and nonmarketable securities & (1,052) & (5,542) & (1,263) \\ \hline Proceeds from disposals of businesses, equity method investments and nonmarketable securities & 189 & 429 & 1,362 \\ \hline Purchases of property, plant and equipment & (1,177) & (2,054) & (1,548) \\ \hline Proceeds from disposals of property, plant and equipment & 189 & 978 & 248 \\ \hline Other investing activities & 122 & (56) & (60) \\ \hline Net Gash Provided by (Used in) Investing Activities & (1,477) & (3,976) & 5,927 \\ \hline \multicolumn{4}{|l|}{ Financing Activities } \\ \hline Issuances of debt & 26,934 & 23,009 & 27,605 \\ \hline Payments of debt & (28,796) & (24,850) & (30,600) \\ \hline Issuances of stock & 647 & 1,012 & 1,476 \\ \hline Purchases of stock for treasury & (118) & (1,103) & (1,912) \\ \hline Dividends & (7,047) & (6,845) & (6,644) \\ \hline Other financing activities & 310 & (227) & (272) \\ \hline \end{tabular} \begin{tabular}{|c|c|c|c|c|} \hline Other financing activities & & 310 & (227) & (272) \\ \hline Net Gash Provided by (Used in) Financing Activities & & (8,070) & (9,004) & (10,347) \\ \hline Effect of Exchange Rate Ghanges on Gash, Cash Equivalents, Restricted Cash and Restricted Gash Equivalents & & 76 & (72) & (262) \\ \hline \multicolumn{5}{|l|}{ Cash, Gash Equivalents, Restricted Gash and Restricted Gash Equivalents } \\ \hline Net increase (decrease) in cash, cash equivalents, restricted cash and restricted cash equivalents during the year & & 373 & (2,581) & 2,945 \\ \hline Cash, cash equivalents, restricted cash and restricted cash equivalents at beginning of year & & 6,737 & 9,318 & 6,373 \\ \hline Gash, Gash Equivalents, Restricted Cash and Restricted Gash Equivalents at End of Year & & 7,110 & 6,737 & 9,318 \\ \hline Less: Restricted cash and restricted cash equivalents at end of year & & 315 & 257 & 241 \\ \hline Cash and Gash Equivalents at End of Year & & $6,795 & $6,480 & $9,077 \\ \hline \multicolumn{5}{|c|}{\begin{tabular}{l} THE COGA-COLA COMPANY AND SUBSIDIARIES \\ CONSOLIDATED STATEMENTS OF SHAREOWNERS' EQUITY \\ (In millions except per share data) \end{tabular}} \\ \hline Year Ended December 31, & 2020 & 2019 & & 2018 \\ \hline \multicolumn{5}{|l|}{ Equity Attributable to Shareowners of The Coca-Cola Company } \\ \hline \multicolumn{5}{|l|}{ Number of Common Shares Outstanding } \\ \hline Balance at beginning of year & 4,280 & & 4,268 & 4,259 \\ \hline Treasury stock issued to employees related to stock-based compensation plans & 22 & & 33 & 48 \\ \hline Purchases of stock for treasury & & & (21) & (39) \\ \hline Balance at end of year & 4,302 & & 4,280 & 4,268 \\ \hline Common Stock & $1,760 & & 1,760 & $1,760 \\ \hline \multicolumn{5}{|l|}{ Capital Surplus } \\ \hline Balance at beginning of year & 17,154 & & 6,520 & 15,864 \\ \hline Stock issued to employees related to stock-based compensation plans & 307 & & 433 & 467 \\ \hline Stock-based compensation expense & 141 & & 201 & 225 \\ \hline Other activities & (1) & & & (36) \\ \hline Balance at end of year & 17,601 & & 7,154 & 16,520 \\ \hline \multicolumn{5}{|l|}{ Reinvested Earnings } \\ \hline Balance at beginning of year & 65,855 & & 3,234 & 60,430 \\ \hline Adoption of accounting standards_s & & & 546 & 3,014 \\ \hline Net income attributable to shareowners of The Coca-Cola Company & 7,747 & & 8,920 & 6,434 \\ \hline Dividends (per share $1.64,$1.60 and $1.56 in 2020,2019 and 2018 , respectively) & (7,047) & & 6,845) & (6,644) \\ \hline Balance at end of year & 66,555 & & 5,855 & 63,234 \\ \hline \end{tabular} \begin{tabular}{|c|c|c|c|} \hline Net income attributable to shareowners of The Coca-Cola Company & 7,747 & 8,920 & 6,434 \\ \hline Dividends (per share $1.64,$1.60 and $1.56 in 2020,2019 and 2018 , respectively) & (7,047) & (6,845) & (6,644) \\ \hline Balance at end of year & 66,555 & 65,855 & 63,234 \\ \hline \multicolumn{4}{|l|}{ Accumulated Other Comprehensive Income (Loss) } \\ \hline Balance at beginning of year & (13,544) & (12,814) & (10,305) \\ \hline Adoption of accounting standards_ & - & (564) & (409) \\ \hline Net other comprehensive income (loss) & (1,057) & (166) & (2,100) \\ \hline Balance at end of year & (14,601) & (13,544) & (12,814) \\ \hline \multicolumn{4}{|l|}{ Treasury Stock } \\ \hline Balance at beginning of year & (52,244) & (51,719) & (50,677) \\ \hline Treasury stock issued to employees related to stock-based compensation plans & 228 & 501 & 704 \\ \hline Purchases of stock for treasury & & (1,026) & (1,746) \\ \hline Balance at end of year & (52,016) & (52,244) & (51,719) \\ \hline Total Equity Attributable to Shareowners of The Coca-Cola Company & $19,299 & $18,981 & $16,981 \\ \hline \multicolumn{4}{|l|}{ Equity Attributable to Noncontrolling Interests } \\ \hline Balance at beginning of year & $2,117 & $2,077 & $1,905 \\ \hline Net income attributable to noncontrolling interests & 21 & 65 & 42 \\ \hline Net foreign currency translation adjustments & (153) & 45 & 53 \\ \hline Dividends paid to noncontrolling interests & (18) & (48) & (31) \\ \hline Acquisition of interests held by noncontrolling owners & & (84) & - \\ \hline Contributions by noncontrolling interests & 17 & 3 & \\ \hline Business combinations & 1 & 59 & 101 \\ \hline Other activities & & - & 7 \\ \hline Total Equity Attributable to Noncontrolling Interests & $1,985 & $2,117 & $2,077 \\ \hline \end{tabular} Specimen Financial Statements: PepsiCo, Inc. consumers in more than 200 countries and territories. Consolidated Statement of Income PepsiCo, Inc. and Subsidiaries Fiscal years ended December 26, 2020, December 28, 2019 and December 29, 2018 (in millions except per share amounts) Consolidated Statement of Comprehensive Income Danailn Ins and Cuhaidianias \begin{tabular}{|c|c|c|c|} \hline \multicolumn{4}{|l|}{ Operating Activities } \\ \hline Net income & $7,175 & $7,353 & $12,559 \\ \hline Depreciation and amortization & 2,548 & 2,432 & 2,399 \\ \hline Share-based compensation expense & 264 & 237 & 256 \\ \hline Restructuring and impairment charges & 289 & 370 & 308 \\ \hline Cash payments for restructuring charges & (255) & (350) & (255) \\ \hline Inventory fair value adjustments and merger and integration charges & 255 & 55 & 75 \\ \hline Cash payments for merger and integration charges & (131) & (10) & (73) \\ \hline Pension and retiree medical plan expenses & 408 & 519 & 221 \\ \hline Pension and retiree medical plan contributions & (562) & (716) & (1,708) \\ \hline Deferred income taxes and other tax charges and credits & 361 & 453 & (531) \\ \hline Net tax related to the TCJ Act & - & (8) & (28) \\ \hline Tax payments related to the TCJ Act & (78) & (423) & (115) \\ \hline Other net tax benefits related to international reorganizations & & (2) & (4,347) \\ \hline \multicolumn{4}{|l|}{ Change in assets and liabilities: } \\ \hline Accounts and notes receivable & (420) & (650) & (253) \\ \hline Inventories & (516) & (190) & (174) \\ \hline Prepaid expenses and other current assets & 26 & (87) & 9 \\ \hline Accounts payable and other current liabilities & 766 & 735 & 882 \\ \hline Income taxes payable & (159) & (287) & 448 \\ \hline Other, net & 642 & 218 & (258) \\ \hline Net Cash Provided by Operating Activities & 10,613 & 9,649 & 9,415 \\ \hline \multicolumn{4}{|l|}{ Investing Activities } \\ \hline Capital spending & (4,240) & (4,232) & (3,282) \\ \hline Sales of property, plant and equipment & 55 & 170 & 134 \\ \hline Acquisitions, net of cash acquired, and investments in noncontrolled affiliates & (6,372) & (2,717) & (1,496) \\ \hline Divestitures & 4 & 253 & 505 \\ \hline \multicolumn{4}{|l|}{ Short-term investments, by original maturity: } \\ \hline More than three months - purchases & (1,135) & & (5,637) \\ \hline More than three months - maturities & & 16 & 12,824 \\ \hline More than three months - sales & & 62 & 1,498 \\ \hline \end{tabular} \begin{tabular}{|c|c|c|c|c|} \hline Net Cash Provided by Operating Activities & 10,613 & 9,649 & \multicolumn{2}{|r|}{9,415} \\ \hline \multicolumn{5}{|l|}{ Investing Activities } \\ \hline Capital spending & (4,240) & \multicolumn{2}{|c|}{(4,232)} & (3,282) \\ \hline Sales of property, plant and equipment & 55 & \multicolumn{2}{|c|}{170} & 134 \\ \hline Acquisitions, net of cash acquired, and investments in noncontrolled affiliates & (6,372) & \multicolumn{2}{|c|}{(2,717)} & (1,496) \\ \hline Divestitures & 4 & \multicolumn{2}{|c|}{253} & 505 \\ \hline \multicolumn{5}{|l|}{ Short-term investments, by original maturity: } \\ \hline More than three months - purchases & (1,135) & \multicolumn{2}{|c|}{ - } & (5,637) \\ \hline More than three months - maturities & & \multicolumn{2}{|c|}{16} & 12,824 \\ \hline More than three months - sales & - & \multicolumn{2}{|c|}{62} & 1,498 \\ \hline Three months or less, net & 27 & \multicolumn{2}{|c|}{19} & 16 \\ \hline Other investing, net & 42 & \multicolumn{2}{|c|}{(8)} & 2 \\ \hline \multirow[t]{2}{*}{ Net Cash (Used for)/Provided by Investing Activities } & (11,619) & \multicolumn{2}{|c|}{(6,437)} & 4,564 \\ \hline & & 2020 & 2019 & 2018 \\ \hline \multicolumn{5}{|l|}{ Financing Activities } \\ \hline Proceeds from issuances of long-term debt & & $13,809 & $4,621 & $ \\ \hline Payments of long-term debt & & (1,830) & (3,970) & (4,007) \\ \hline Debt redemption/cash tender and exchange offers & & (1,100) & (1,007) & (1,589) \\ \hline \multicolumn{5}{|l|}{ Short-term borrowings, by original maturity: } \\ \hline More than three months - proceeds & & 4,077 & 6 & 3 \\ \hline More than three months - payments & & (3,554) & (2) & (17) \\ \hline Three months or less, net & & (109) & (3) & (1,352) \\ \hline Cash dividends paid & & (5,509) & (5,304) & (4,930) \\ \hline Share repurchases - common & & (2,000) & (3,000) & (2,000) \\ \hline Proceeds from exercises of stock options & & 179 & 329 & 281 \\ \hline Withholding tax payments on restricted stock units (RSUs), performance stock units (PSUs) and PepsiCo equity performance units (PEPunits) converted & & (96) & (114) & (103) \\ \hline Other financing & & (48) & (45) & (55) \\ \hline Net Cash Provided by/(Used for) Financing Activities & & 3,819 & \begin{tabular}{l} (8,489) \\ \end{tabular} & (13,769) \\ \hline Effect of exchange rate changes on cash and cash equivalents and restricted cash & & (129) & 78 & (98) \\ \hline Net Increase/(Decrease) in Cash and Cash Equivalents and Restricted Cash & & 2,684 & (5,199) & 112 \\ \hline Cash and Cash Equivalents and Restricted Cash, Beginning of Year & & 5,570 & 10,769 & 10,657 \\ \hline \end{tabular} Withholding tax payments on restricted stock units (RSUs), performance stock units (PSUs) and PepsiCo equity performance units (PEPunits) converted \begin{tabular}{|c|c|c|} \hline (96) & (114) & (103) \\ \hline (48) & (45) & (55) \\ \hline 3,819 & (8,489) & (13,769) \\ \hline (129) & 78 & (98) \\ \hline 2,684 & (5,199) & 112 \\ \hline 5,570 & 10,769 & 10,657 \\ \hline$8,254 & $5,570 & $10,769 \\ \hline \end{tabular} Other financing Net Cash Provided by/(Used for) Financing Activities Effect of exchange rate changes on cash and cash equivalents and restricted cash Net Increase/(Decrease) in Cash and Gash Equivalents and Restricted Cash Cash and Cash Equivalents and Restricted Cash, Beginning of Year Cash and Cash Equivalents and Restricted Cash, End of Year Consolidated Balance Sheet PepsiCo, Inc. and Subsidiaries December 26, 2020 and December 28, 2019 (in millions except per share amounts) \begin{tabular}{|c|c|c|} \hline & 2020 & 2019 \\ \hline \multicolumn{3}{|l|}{ ASSETS } \\ \hline \multicolumn{3}{|l|}{ Current Assets } \\ \hline Cash and cash equivalents & $8,185 & $5,509 \\ \hline Short-term investments & 1,366 & 229 \\ \hline Accounts and notes receivable, net & 8,404 & 7,822 \\ \hline Inventories & 4,172 & 3,338 \\ \hline Prepaid expenses and other current assets & 874 & 747 \\ \hline Total Current Assets & 23,001 & 17,645 \\ \hline Property, Plant and Equipment, net & 21,369 & 19,305 \\ \hline Amortizable Intangible Assets, net & 1,703 & 1,433 \\ \hline Goodwill & 18,757 & 15,501 \\ \hline Other Indefinite-Lived Intangible Assets & 17,612 & 14,610 \\ \hline Investments in Noncontrolled Affiliates & 2,792 & 2,683 \\ \hline Deferred Income Taxes & 4,372 & 4,359 \\ \hline Other Assets & 3,312 & 3,011 \\ \hline Total Assets & $92,918 & $78,547 \\ \hline \end{tabular} LIABILITIES AND EQUITY LIABILITIES AND EQUITY Gurrent Liabilities Short-term debt obligations Accounts payable and other current liabilities Total Current Liabilities Long-Term Debt Obligations Deferred Income Taxes Other Liabilities Total Liabilities Commitments and contingencies \begin{tabular}{rrrr} $3,780 & & $2,920 \\ 19,592 & & 17,541 \\ \hline 23,372 & & 20,461 \\ 40,370 & & 29,148 \\ 4,284 & & 4,091 \\ 11,340 & & 9,979 \\ \hline 79,366 & & 63,679 \end{tabular} PepsiCo Common Shareholders' Equity Common stock, par value 12/3 \& per share (authorized 3,600 shares; issued, net of repurchased common stock at par value: 1,380 and 1,391 shares, respectively) Capital in excess of par value Retained earnings Accumulated other comprehensive loss Repurchased common stock, in excess of par value (487 and 476 shares, respectively) Total PepsiCo Common Shareholders' Equity Noncontrolling interests Total Equity Total Liabilities and Equity Consolidated Statement of Equity PepsiCo, Inc. and Subsidiaries Fiscal years ended December 26, 2020, December 28, 2019 and December 29, 2018 (in millions except per share amounts) 2020 2019 2018 Preferred Stock Shares Amount Shares Amount Amount \begin{tabular}{|c|c|c|c|c|c|c|} \hline Balance, end of year & & 3,910 & & 3,886 & & 3,953 \\ \hline \multicolumn{7}{|l|}{ Retained Earnings } \\ \hline Balance, beginning of year & & 61,946 & & 59,947 & & 52,839 \\ \hline Cumulative effect of accounting changes & & (34) & & 8 & & (145) \\ \hline Net income attributable to PepsiCio & & 7,120 & & 7,314 & & 12,515 \\ \hline Cash dividends declared - common a & & (5,589) & & (5,323) & & (5,098) \\ \hline Retirement of preferred stock & & & & - & & (164) \\ \hline Balance, end of year & & 63,443 & & 61,946 & & 59,947 \\ \hline \multicolumn{7}{|l|}{ Accumulated Other Gomprehensive Loss } \\ \hline Balance, beginning of year & & (14,300) & & (15,119) & & (13,057) \\ \hline Other comprehensive (loss)/income attributable to PepsiCo & & (1,176) & & 819 & & (2,062) \\ \hline Balance, end of year & & (15,476) & & (14,300) & & (15,119) \\ \hline \multicolumn{7}{|l|}{ Repurchased Common Stock } \\ \hline Balance, beginning of year & (476) & (36,769) & (458) & (34,286) & (446) & (32,757) \\ \hline Share repurchases & (15) & (2,000) & (24) & (3,000) & (18) & (2,000) \\ \hline Stock option exercises, RSUs, PSUs and PEPunits converted & 4 & 322 & 6 & 516 & 6 & 469 \\ \hline Other & & 1 & - & 1 & - & 2 \\ \hline Balance, end of year & (487) & (38,446) & (476) & (36,769) & (458) & (34,286) \\ \hline Total PepsiCo Common Shareholders' Equity & & 13,454 & & 14,786 & & 14,518 \\ \hline \multicolumn{7}{|l|}{ Noncontrolling Interests } \\ \hline Balance, beginning of year & & 82 & & 84 & & 92 \\ \hline Net income attributable to noncontrolling interests & & 55 & & 39 & & 44 \\ \hline Distributions to noncontrolling interests & & (44) & & (42) & & (49) \\ \hline Acquisitions & & 5 & & - & & - \\ \hline Other, net & & - & & 1 & & (3) \\ \hline Balance, end of year & & 98 & & 82 & & 84 \\ \hline Total Equity & & $13,552 & & $14,868 & & $14,602 \\ \hline \end{tabular} a Cash dividends declared per common share were $4.0225, $3.7925 and $3.5875 for 2020,2019 and 2018, respectively. Current Attempt in Progress The financial statement of Coca-Cola are presented in Appendix C. Click here to view Appendix C. The financial statement of PepsiCo are presented in Appendix D. Click here to view Appendix D. The companies' complete annual reports, including the notes to the financial statements, are available online. Use the companies' financial information to answer the following questions. What format(s) did these companies use to present their balance sheets? Coca-Cola Company and PepsiCo, Inc. use th How much working capital did each of these companies have at the end of 2020? (Enter negative amounts using either a negative sign preceding the number e.g. -45 or parentheses e.g. (45).) What are the companies' annual (2019-2020) and 3-year (2018-2020) growth rates in total assets and long-term debt? (Round answers to 2 decimal places, e.g. 52.75\%. Enter negative amounts using either a negative sign preceding the number e.g. 1.45% or parentheses e.g. (1.45)\%.) Compute both companies' (1) current cash debt coverage, (2) cash debt coverage, and (3) free cash flow. (Enter amount in millions. Round ratios to 2 decimal places, e.g. 52.75:1.) Appenalix C Specimen Financial Statements: The Coca-Cola Company are now available in more than 200 countries. THE COGA-COLA COMPANY AND SUBSIDIARIES CONSOLIDATED STATEMENTS OF INGOME (In millions except per share data) _Cialculated based on net income attributable to shareowners of The Cioca-Ciola Ciompany. THE GOCA-COLA COMPANY AND SUBSIDIARIES GONSOLIDATED STATEMENTS OF COMPREHENSIVE INCOME (In millions) \begin{tabular}{|c|c|c|} \hline Year Ended December 31, & 2020 & 2018 \\ \hline Gonsolidated Net Income & $7,768 & $6,476 \\ \hline \multicolumn{3}{|l|}{ Other Comprehensive Income: } \\ \hline Net foreign currency translation adjustments & (911) & (2,035) \\ \hline Net gains (losses) on derivatives & (54) & (7) \\ \hline Net change in unrealized gains (losses) on available-for-sale debt securities & (47) & (34) \\ \hline Net change in pension and other postretirement benefit liabilities & (267) & 29 \\ \hline Total Comprehensive Income & 6,558 & 4,429 \\ \hline Less: Comprehensive income attributable to noncontrolling interests & (132) & 95 \\ \hline Total Comprehensive Income Attributable to Shareowners of The Coca-Cola Company & $6,690 & $4,334 \\ \hline \begin{tabular}{r} THE COCA-COLA CO \\ CON million \end{tabular} & & \\ \hline December 31 , & 2020 & 2019 \\ \hline \multicolumn{3}{|c|}{ ASSETS } \\ \hline \multicolumn{3}{|l|}{ Gurrent Assets } \\ \hline Cash and cash equivalents & $6,795 & $6,480 \\ \hline Short-term investments & 1,771 & 1,467 \\ \hline Total Cash, Cash Equivalents and Short-Term Investments & 8,566 & 7,947 \\ \hline Marketable securities & 2,348 & 3,228 \\ \hline Trade accounts receivable, less allowances of $526 and $524, respectively & 3,144 & 3,971 \\ \hline Inventories & 3,266 & 3,379 \\ \hline Prepaid expenses and other assets & 1,916 & 1,886 \\ \hline Total Gurrent Assets & 19,240 & 20,411 \\ \hline Equity method investments & 19,273 & 19,025 \\ \hline Other investments & 812 & 854 \\ \hline Other assets & 6,184 & 6,075 \\ \hline Deferred income tax assets & 2,460 & 2,412 \\ \hline \end{tabular} \begin{tabular}{|c|c|c|} \hline Deferred income tax assets & 2,460 & 2,412 \\ \hline Property, plant and equipment - net & 10,777 & 10,838 \\ \hline Trademarks with indefinite lives & 10,395 & 9,266 \\ \hline Goodwill & 17,506 & 16,764 \\ \hline Other intangible assets & 649 & 736 \\ \hline Total Assets & $87,296 & $86,381 \\ \hline \multicolumn{3}{|c|}{ LIABILITIES AND EQUITY } \\ \hline \multicolumn{3}{|l|}{ Gurrent Liabilities } \\ \hline Accounts payable and accrued expenses & $11,145 & $11,312 \\ \hline Loans and notes payable & 2,183 & 10,994 \\ \hline Current maturities of long-term debt & 485 & 4,253 \\ \hline Accrued income taxes & 788 & 414 \\ \hline Total Current Liabilities & 14,601 & 26,973 \\ \hline Long-term debt & 40,125 & 27,516 \\ \hline Other liabilities & 9,453 & 8,510 \\ \hline Deferred income tax liabilities & 1,833 & 2,284 \\ \hline \multicolumn{3}{|l|}{ The Coca-Cola Company Shareowners' Equity } \\ \hline Common stock, $0.25 par value; authorized 11,200 shares; issued 7,040 shares & 1,760 & 1,760 \\ \hline Capital surplus & 17,601 & 17,154 \\ \hline Reinvested earnings & 66,555 & 65,855 \\ \hline Accumulated other comprehensive income (loss) & (14,601) & (13,544) \\ \hline Treasury stock, at cost 2,738 and 2,760 shares, respectively & (52,016) & (52,244) \\ \hline Equity Attributable to Shareowners of The Coca-Cola Company & 19,299 & 18,981 \\ \hline Equity attributable to noncontrolling interests & 1,985 & 2,117 \\ \hline Total Equity & 21,284 & 21,098 \\ \hline Total Liabilities and Equity & $87,296 & $86,381 \\ \hline \end{tabular} THE GOCA-GOLA COMPANY AND SUBSIDIARIES GONSOLIDATED STATEMENTS OF GASH FLOWS (In millions) \begin{tabular}{|c|c|c|c|} \hline Year Ended December 31, & 2020 & 2019 & 2018 \\ \hline \multicolumn{4}{|l|}{ Operating Activities } \\ \hline Consolidated net income & $7,768 & $8,985 & $6,476 \\ \hline Depreciation and amortization & 1,536 & 1,365 & 1,086 \\ \hline Stock-based compensation expense & 126 & 201 & 225 \\ \hline Deferred income taxes & (18) & (280) & (413) \\ \hline Equity (income) loss - net of dividends & (511) & (421) & (457) \\ \hline Foreign currency adjustments & (88) & 91 & (50) \\ \hline Significant (gains) losses - net & (914) & (467) & 743 \\ \hline Other operating charges & 556 & 127 & 558 \\ \hline Other items & 699 & 504 & 699 \\ \hline Net change in operating assets and liabilities & 690 & 366 & (1,240) \\ \hline Net Cash Provided by Operating Activities & 9,844 & 10,471 & 7,627 \\ \hline \multicolumn{4}{|l|}{ Investing Activities } \\ \hline Purchases of investments & (13,583) & (4,704) & (7,789) \\ \hline Proceeds from disposals of investments & 13,835 & 6,973 & 14,977 \\ \hline Acquisitions of businesses, equity method investments and nonmarketable securities & (1,052) & (5,542) & (1,263) \\ \hline Proceeds from disposals of businesses, equity method investments and nonmarketable securities & 189 & 429 & 1,362 \\ \hline Purchases of property, plant and equipment & (1,177) & (2,054) & (1,548) \\ \hline Proceeds from disposals of property, plant and equipment & 189 & 978 & 248 \\ \hline Other investing activities & 122 & (56) & (60) \\ \hline Net Gash Provided by (Used in) Investing Activities & (1,477) & (3,976) & 5,927 \\ \hline \multicolumn{4}{|l|}{ Financing Activities } \\ \hline Issuances of debt & 26,934 & 23,009 & 27,605 \\ \hline Payments of debt & (28,796) & (24,850) & (30,600) \\ \hline Issuances of stock & 647 & 1,012 & 1,476 \\ \hline Purchases of stock for treasury & (118) & (1,103) & (1,912) \\ \hline Dividends & (7,047) & (6,845) & (6,644) \\ \hline Other financing activities & 310 & (227) & (272) \\ \hline \end{tabular} \begin{tabular}{|c|c|c|c|c|} \hline Other financing activities & & 310 & (227) & (272) \\ \hline Net Gash Provided by (Used in) Financing Activities & & (8,070) & (9,004) & (10,347) \\ \hline Effect of Exchange Rate Ghanges on Gash, Cash Equivalents, Restricted Cash and Restricted Gash Equivalents & & 76 & (72) & (262) \\ \hline \multicolumn{5}{|l|}{ Cash, Gash Equivalents, Restricted Gash and Restricted Gash Equivalents } \\ \hline Net increase (decrease) in cash, cash equivalents, restricted cash and restricted cash equivalents during the year & & 373 & (2,581) & 2,945 \\ \hline Cash, cash equivalents, restricted cash and restricted cash equivalents at beginning of year & & 6,737 & 9,318 & 6,373 \\ \hline Gash, Gash Equivalents, Restricted Cash and Restricted Gash Equivalents at End of Year & & 7,110 & 6,737 & 9,318 \\ \hline Less: Restricted cash and restricted cash equivalents at end of year & & 315 & 257 & 241 \\ \hline Cash and Gash Equivalents at End of Year & & $6,795 & $6,480 & $9,077 \\ \hline \multicolumn{5}{|c|}{\begin{tabular}{l} THE COGA-COLA COMPANY AND SUBSIDIARIES \\ CONSOLIDATED STATEMENTS OF SHAREOWNERS' EQUITY \\ (In millions except per share data) \end{tabular}} \\ \hline Year Ended December 31, & 2020 & 2019 & & 2018 \\ \hline \multicolumn{5}{|l|}{ Equity Attributable to Shareowners of The Coca-Cola Company } \\ \hline \multicolumn{5}{|l|}{ Number of Common Shares Outstanding } \\ \hline Balance at beginning of year & 4,280 & & 4,268 & 4,259 \\ \hline Treasury stock issued to employees related to stock-based compensation plans & 22 & & 33 & 48 \\ \hline Purchases of stock for treasury & & & (21) & (39) \\ \hline Balance at end of year & 4,302 & & 4,280 & 4,268 \\ \hline Common Stock & $1,760 & & 1,760 & $1,760 \\ \hline \multicolumn{5}{|l|}{ Capital Surplus } \\ \hline Balance at beginning of year & 17,154 & & 6,520 & 15,864 \\ \hline Stock issued to employees related to stock-based compensation plans & 307 & & 433 & 467 \\ \hline Stock-based compensation expense & 141 & & 201 & 225 \\ \hline Other activities & (1) & & & (36) \\ \hline Balance at end of year & 17,601 & & 7,154 & 16,520 \\ \hline \multicolumn{5}{|l|}{ Reinvested Earnings } \\ \hline Balance at beginning of year & 65,855 & & 3,234 & 60,430 \\ \hline Adoption of accounting standards_s & & & 546 & 3,014 \\ \hline Net income attributable to shareowners of The Coca-Cola Company & 7,747 & & 8,920 & 6,434 \\ \hline Dividends (per share $1.64,$1.60 and $1.56 in 2020,2019 and 2018 , respectively) & (7,047) & & 6,845) & (6,644) \\ \hline Balance at end of year & 66,555 & & 5,855 & 63,234 \\ \hline \end{tabular} \begin{tabular}{|c|c|c|c|} \hline Net income attributable to shareowners of The Coca-Cola Company & 7,747 & 8,920 & 6,434 \\ \hline Dividends (per share $1.64,$1.60 and $1.56 in 2020,2019 and 2018 , respectively) & (7,047) & (6,845) & (6,644) \\ \hline Balance at end of year & 66,555 & 65,855 & 63,234 \\ \hline \multicolumn{4}{|l|}{ Accumulated Other Comprehensive Income (Loss) } \\ \hline Balance at beginning of year & (13,544) & (12,814) & (10,305) \\ \hline Adoption of accounting standards_ & - & (564) & (409) \\ \hline Net other comprehensive income (loss) & (1,057) & (166) & (2,100) \\ \hline Balance at end of year & (14,601) & (13,544) & (12,814) \\ \hline \multicolumn{4}{|l|}{ Treasury Stock } \\ \hline Balance at beginning of year & (52,244) & (51,719) & (50,677) \\ \hline Treasury stock issued to employees related to stock-based compensation plans & 228 & 501 & 704 \\ \hline Purchases of stock for treasury & & (1,026) & (1,746) \\ \hline Balance at end of year & (52,016) & (52,244) & (51,719) \\ \hline Total Equity Attributable to Shareowners of The Coca-Cola Company & $19,299 & $18,981 & $16,981 \\ \hline \multicolumn{4}{|l|}{ Equity Attributable to Noncontrolling Interests } \\ \hline Balance at beginning of year & $2,117 & $2,077 & $1,905 \\ \hline Net income attributable to noncontrolling interests & 21 & 65 & 42 \\ \hline Net foreign currency translation adjustments & (153) & 45 & 53 \\ \hline Dividends paid to noncontrolling interests & (18) & (48) & (31) \\ \hline Acquisition of interests held by noncontrolling owners & & (84) & - \\ \hline Contributions by noncontrolling interests & 17 & 3 & \\ \hline Business combinations & 1 & 59 & 101 \\ \hline Other activities & & - & 7 \\ \hline Total Equity Attributable to Noncontrolling Interests & $1,985 & $2,117 & $2,077 \\ \hline \end{tabular} Specimen Financial Statements: PepsiCo, Inc. consumers in more than 200 countries and territories. Consolidated Statement of Income PepsiCo, Inc. and Subsidiaries Fiscal years ended December 26, 2020, December 28, 2019 and December 29, 2018 (in millions except per share amounts) Consolidated Statement of Comprehensive Income Danailn Ins and Cuhaidianias \begin{tabular}{|c|c|c|c|} \hline \multicolumn{4}{|l|}{ Operating Activities } \\ \hline Net income & $7,175 & $7,353 & $12,559 \\ \hline Depreciation and amortization & 2,548 & 2,432 & 2,399 \\ \hline Share-based compensation expense & 264 & 237 & 256 \\ \hline Restructuring and impairment charges & 289 & 370 & 308 \\ \hline Cash payments for restructuring charges & (255) & (350) & (255) \\ \hline Inventory fair value adjustments and merger and integration charges & 255 & 55 & 75 \\ \hline Cash payments for merger and integration charges & (131) & (10) & (73) \\ \hline Pension and retiree medical plan expenses & 408 & 519 & 221 \\ \hline Pension and retiree medical plan contributions & (562) & (716) & (1,708) \\ \hline Deferred income taxes and other tax charges and credits & 361 & 453 & (531) \\ \hline Net tax related to the TCJ Act & - & (8) & (28) \\ \hline Tax payments related to the TCJ Act & (78) & (423) & (115) \\ \hline Other net tax benefits related to international reorganizations & & (2) & (4,347) \\ \hline \multicolumn{4}{|l|}{ Change in assets and liabilities: } \\ \hline Accounts and notes receivable & (420) & (650) & (253) \\ \hline Inventories & (516) & (190) & (174) \\ \hline Prepaid expenses and other current assets & 26 & (87) & 9 \\ \hline Accounts payable and other current liabilities & 766 & 735 & 882 \\ \hline Income taxes payable & (159) & (287) & 448 \\ \hline Other, net & 642 & 218 & (258) \\ \hline Net Cash Provided by Operating Activities & 10,613 & 9,649 & 9,415 \\ \hline \multicolumn{4}{|l|}{ Investing Activities } \\ \hline Capital spending & (4,240) & (4,232) & (3,282) \\ \hline Sales of property, plant and equipment & 55 & 170 & 134 \\ \hline Acquisitions, net of cash acquired, and investments in noncontrolled affiliates & (6,372) & (2,717) & (1,496) \\ \hline Divestitures & 4 & 253 & 505 \\ \hline \multicolumn{4}{|l|}{ Short-term investments, by original maturity: } \\ \hline More than three months - purchases & (1,135) & & (5,637) \\ \hline More than three months - maturities & & 16 & 12,824 \\ \hline More than three months - sales & & 62 & 1,498 \\ \hline \end{tabular} \begin{tabular}{|c|c|c|c|c|} \hline Net Cash Provided by Operating Activities & 10,613 & 9,649 & \multicolumn{2}{|r|}{9,415} \\ \hline \multicolumn{5}{|l|}{ Investing Activities } \\ \hline Capital spending & (4,240) & \multicolumn{2}{|c|}{(4,232)} & (3,282) \\ \hline Sales of property, plant and equipment & 55 & \multicolumn{2}{|c|}{170} & 134 \\ \hline Acquisitions, net of cash acquired, and investments in noncontrolled affiliates & (6,372) & \multicolumn{2}{|c|}{(2,717)} & (1,496) \\ \hline Divestitures & 4 & \multicolumn{2}{|c|}{253} & 505 \\ \hline \multicolumn{5}{|l|}{ Short-term investments, by original maturity: } \\ \hline More than three months - purchases & (1,135) & \multicolumn{2}{|c|}{ - } & (5,637) \\ \hline More than three months - maturities & & \multicolumn{2}{|c|}{16} & 12,824 \\ \hline More than three months - sales & - & \multicolumn{2}{|c|}{62} & 1,498 \\ \hline Three months or less, net & 27 & \multicolumn{2}{|c|}{19} & 16 \\ \hline Other investing, net & 42 & \multicolumn{2}{|c|}{(8)} & 2 \\ \hline \multirow[t]{2}{*}{ Net Cash (Used for)/Provided by Investing Activities } & (11,619) & \multicolumn{2}{|c|}{(6,437)} & 4,564 \\ \hline & & 2020 & 2019 & 2018 \\ \hline \multicolumn{5}{|l|}{ Financing Activities } \\ \hline Proceeds from issuances of long-term debt & & $13,809 & $4,621 & $ \\ \hline Payments of long-term debt & & (1,830) & (3,970) & (4,007) \\ \hline Debt redemption/cash tender and exchange offers & & (1,100) & (1,007) & (1,589) \\ \hline \multicolumn{5}{|l|}{ Short-term borrowings, by original maturity: } \\ \hline More than three months - proceeds & & 4,077 & 6 & 3 \\ \hline More than three months - payments & & (3,554) & (2) & (17) \\ \hline Three months or less, net & & (109) & (3) & (1,352) \\ \hline Cash dividends paid & & (5,509) & (5,304) & (4,930) \\ \hline Share repurchases - common & & (2,000) & (3,000) & (2,000) \\ \hline Proceeds from exercises of stock options & & 179 & 329 & 281 \\ \hline Withholding tax payments on restricted stock units (RSUs), performance stock units (PSUs) and PepsiCo equity performance units (PEPunits) converted & & (96) & (114) & (103) \\ \hline Other financing & & (48) & (45) & (55) \\ \hline Net Cash Provided by/(Used for) Financing Activities & & 3,819 & \begin{tabular}{l} (8,489) \\ \end{tabular} & (13,769) \\ \hline Effect of exchange rate changes on cash and cash equivalents and restricted cash & & (129) & 78 & (98) \\ \hline Net Increase/(Decrease) in Cash and Cash Equivalents and Restricted Cash & & 2,684 & (5,199) & 112 \\ \hline Cash and Cash Equivalents and Restricted Cash, Beginning of Year & & 5,570 & 10,769 & 10,657 \\ \hline \end{tabular} Withholding tax payments on restricted stock units (RSUs), performance stock units (PSUs) and PepsiCo equity performance units (PEPunits) converted \begin{tabular}{|c|c|c|} \hline (96) & (114) & (103) \\ \hline (48) & (45) & (55) \\ \hline 3,819 & (8,489) & (13,769) \\ \hline (129) & 78 & (98) \\ \hline 2,684 & (5,199) & 112 \\ \hline 5,570 & 10,769 & 10,657 \\ \hline$8,254 & $5,570 & $10,769 \\ \hline \end{tabular} Other financing Net Cash Provided by/(Used for) Financing Activities Effect of exchange rate changes on cash and cash equivalents and restricted cash Net Increase/(Decrease) in Cash and Gash Equivalents and Restricted Cash Cash and Cash Equivalents and Restricted Cash, Beginning of Year Cash and Cash Equivalents and Restricted Cash, End of Year Consolidated Balance Sheet PepsiCo, Inc. and Subsidiaries December 26, 2020 and December 28, 2019 (in millions except per share amounts) \begin{tabular}{|c|c|c|} \hline & 2020 & 2019 \\ \hline \multicolumn{3}{|l|}{ ASSETS } \\ \hline \multicolumn{3}{|l|}{ Current Assets } \\ \hline Cash and cash equivalents & $8,185 & $5,509 \\ \hline Short-term investments & 1,366 & 229 \\ \hline Accounts and notes receivable, net & 8,404 & 7,822 \\ \hline Inventories & 4,172 & 3,338 \\ \hline Prepaid expenses and other current assets & 874 & 747 \\ \hline Total Current Assets & 23,001 & 17,645 \\ \hline Property, Plant and Equipment, net & 21,369 & 19,305 \\ \hline Amortizable Intangible Assets, net & 1,703 & 1,433 \\ \hline Goodwill & 18,757 & 15,501 \\ \hline Other Indefinite-Lived Intangible Assets & 17,612 & 14,610 \\ \hline Investments in Noncontrolled Affiliates & 2,792 & 2,683 \\ \hline Deferred Income Taxes & 4,372 & 4,359 \\ \hline Other Assets & 3,312 & 3,011 \\ \hline Total Assets & $92,918 & $78,547 \\ \hline \end{tabular} LIABILITIES AND EQUITY LIABILITIES AND EQUITY Gurrent Liabilities Short-term debt obligations Accounts payable and other current liabilities Total Current Liabilities Long-Term Debt Obligations Deferred Income Taxes Other Liabilities Total Liabilities Commitments and contingencies \begin{tabular}{rrrr} $3,780 & & $2,920 \\ 19,592 & & 17,541 \\ \hline 23,372 & & 20,461 \\ 40,370 & & 29,148 \\ 4,284 & & 4,091 \\ 11,340 & & 9,979 \\ \hline 79,366 & & 63,679 \end{tabular} PepsiCo Common Shareholders' Equity Common stock, par value 12/3 \& per share (authorized 3,600 shares; issued, net of repurchased common stock at par value: 1,380 and 1,391 shares, respectively) Capital in excess of par value Retained earnings Accumulated other comprehensive loss Repurchased common stock, in excess of par value (487 and 476 shares, respectively) Total PepsiCo Common Shareholders' Equity Noncontrolling interests Total Equity Total Liabilities and Equity Consolidated Statement of Equity PepsiCo, Inc. and Subsidiaries Fiscal years ended December 26, 2020, December 28, 2019 and December 29, 2018 (in millions except per share amounts) 2020 2019 2018 Preferred Stock Shares Amount Shares Amount Amount \begin{tabular}{|c|c|c|c|c|c|c|} \hline Balance, end of year & & 3,910 & & 3,886 & & 3,953 \\ \hline \multicolumn{7}{|l|}{ Retained Earnings } \\ \hline Balance, beginning of year & & 61,946 & & 59,947 & & 52,839 \\ \hline Cumulative effect of accounting changes & & (34) & & 8 & & (145) \\ \hline Net income attributable to PepsiCio & & 7,120 & & 7,314 & & 12,515 \\ \hline Cash dividends declared - common a & & (5,589) & & (5,323) & & (5,098) \\ \hline Retirement of preferred stock & & & & - & & (164) \\ \hline Balance, end of year & & 63,443 & & 61,946 & & 59,947 \\ \hline \multicolumn{7}{|l|}{ Accumulated Other Gomprehensive Loss } \\ \hline Balance, beginning of year & & (14,300) & & (15,119) & & (13,057) \\ \hline Other comprehensive (loss)/income attributable to PepsiCo & & (1,176) & & 819 & & (2,062) \\ \hline Balance, end of year & & (15,476) & & (14,300) & & (15,119) \\ \hline \multicolumn{7}{|l|}{ Repurchased Common Stock } \\ \hline Balance, beginning of year & (476) & (36,769) & (458) & (34,286) & (446) & (32,757) \\ \hline Share repurchases & (15) & (2,000) & (24) & (3,000) & (18) & (2,000) \\ \hline Stock option exercises, RSUs, PSUs and PEPunits converted & 4 & 322 & 6 & 516 & 6 & 469 \\ \hline Other & & 1 & - & 1 & - & 2 \\ \hline Balance, end of year & (487) & (38,446) & (476) & (36,769) & (458) & (34,286) \\ \hline Total PepsiCo Common Shareholders' Equity & & 13,454 & & 14,786 & & 14,518 \\ \hline \multicolumn{7}{|l|}{ Noncontrolling Interests } \\ \hline Balance, beginning of year & & 82 & & 84 & & 92 \\ \hline Net income attributable to noncontrolling interests & & 55 & & 39 & & 44 \\ \hline Distributions to noncontrolling interests & & (44) & & (42) & & (49) \\ \hline Acquisitions & & 5 & & - & & - \\ \hline Other, net & & - & & 1 & & (3) \\ \hline Balance, end of year & & 98 & & 82 & & 84 \\ \hline Total Equity & & $13,552 & & $14,868 & & $14,602 \\ \hline \end{tabular} a Cash dividends declared per common share were $4.0225, $3.7925 and $3.5875 for 2020,2019 and 2018, respectivelyStep by Step Solution
There are 3 Steps involved in it
Step: 1

Get Instant Access to Expert-Tailored Solutions
See step-by-step solutions with expert insights and AI powered tools for academic success
Step: 2

Step: 3

Ace Your Homework with AI
Get the answers you need in no time with our AI-driven, step-by-step assistance
Get Started


