Answered step by step
Verified Expert Solution
Question
1 Approved Answer
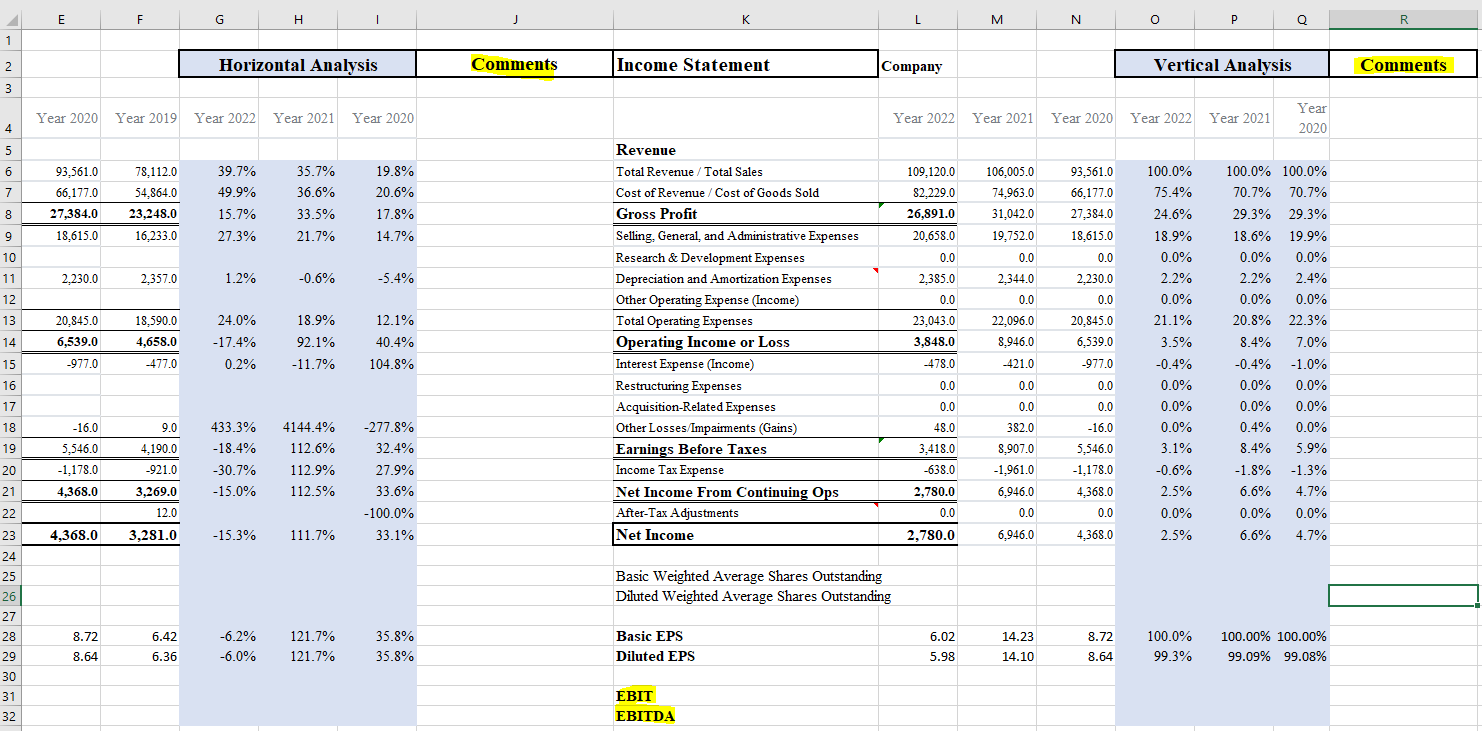
Address the following questions in the comments section of Income Statement: Identify which accounts had a large magnitude of change of 10% or more. Identify
Address the following questions in the comments section of Income Statement:
- Identify which accounts had a large magnitude of change of 10% or more.
- Identify which accounts changed for the period and explain how this affected the financial analysis calculation.
- Explain why the account changed during the period, what business decisions may have caused the change, and how these changes impacted company performance.

E F G H 1 2 Horizontal Analysis 3 Year 2020 Year 2019 Year 2022 Year 2021 Year 2020 K L M N Comments Income Statement P R Company Vertical Analysis Year 2022 Year 2021 Year 2020 Year 2022 Year 2021 Year 2020 4 5 6 93,561.0 78,112.0 39.7% 35.7% 19.8% Revenue Total Revenue / Total Sales 109,120.0 106,005.0 93,561.0 100.0% 100.0% 100.0% 7 66,177.0 54,864.0 49.9% 36.6% 20.6% 8 27,384.0 23,248.0 15.7% 33.5% 17.8% Cost of Revenue/Cost of Goods Sold Gross Profit 82.229.0 74,963.0 66,177.0 75.4% 70.7% 70.7% 26,891.0 31,042.0 27,384.0 24.6% 29.3% 29.3% 9 18,615.0 16,233.0 27.3% 21.7% 14.7% 10 11 2,230.0 2,357.0 1.2% -0.6% -5.4% Selling, General, and Administrative Expenses Research & Development Expenses Depreciation and Amortization Expenses 20,658.0 19,752.0 18,615.0 18.9% 18.6% 19.9% 12 Other Operating Expense (Income) 0.0 2,385.0 0.0 0.0 0.0 0.0% 0.0% 0.0% 2,344.0 0.0 2,230.0 2.2% 2.2% 2.4% 0.0 0.0% 0.0% 0.0% 13 20,845.0 18,590.0 24.0% 18.9% 12.1% 14 6,539.0 4,658.0 -17.4% 92.1% 40.4% 15 -977.0 -477.0 0.2% -11.7% 104.8% Total Operating Expenses Operating Income or Loss Interest Expense (Income) 23,043.0 22,096.0 20,845.0 21.1% 20.8% 22.3% 3,848.0 8,946.0 6,539.0 3.5% 8.4% 7.0% -478.0 -421.0 -977.0 -0.4% -0.4% -1.0% 16 Restructuring Expenses 0.0 0.0 0.0 0.0% 0.0% 0.0% 17 Acquisition-Related Expenses 0.0 0.0 0.0 0.0% 0.0% 0.0% 18 -16.0 9.0 433.3% 4144.4% -277.8% Other Losses/Impairments (Gains) 48.0 382.0 -16.0 0.0% 0.4% 0.0% 19 5,546.0 20 -1,178.0 4,190.0 -921.0 -18.4% 112.6% 32.4% Earnings Before Taxes 3,418.0 8,907.0 5,546.0 3.1% 8.4% 5.9% -30.7% 112.9% 27.9% Income Tax Expense -638.0 -1,961.0 -1,178.0 -0.6% -1.8% -1.3% 21 4,368.0 3,269.0 -15.0% 112.5% 33.6% Net Income From Continuing Ops 2,780.0 6,946.0 4,368.0 2.5% 6.6% 4.7% 22 12.0 -100.0% After-Tax Adjustments 0.0 23 4,368.0 3,281.0 -15.3% 111.7% 33.1% Net Income 2,780.0 0.0 6,946.0 0.0 0.0% 0.0% 0.0% 4,368.0 2.5% 6.6% 4.7% 24 25 26 Basic Weighted Average Shares Outstanding Diluted Weighted Average Shares Outstanding 27 28 8.72 6.42 -6.2% 121.7% 35.8% Basic EPS 29 8.64 6.36 -6.0% 121.7% 35.8% Diluted EPS 6.02 14.23 8.72 5.98 14.10 8.64 100.0% 99.3% 100.00% 100.00% 99.09% 99.08% 30 31 32 EBIT EBITDA Comments
Step by Step Solution
★★★★★
3.45 Rating (152 Votes )
There are 3 Steps involved in it
Step: 1
Answer Horizontal Analysis Comments 1 Accounts with a large magnitude of change 10 or more Revenue Increased by 397 in 2022 compared to 2021 and by 357 in 2021 compared to 2020 This indicates signific...
Get Instant Access to Expert-Tailored Solutions
See step-by-step solutions with expert insights and AI powered tools for academic success
Step: 2

Step: 3

Ace Your Homework with AI
Get the answers you need in no time with our AI-driven, step-by-step assistance
Get Started


