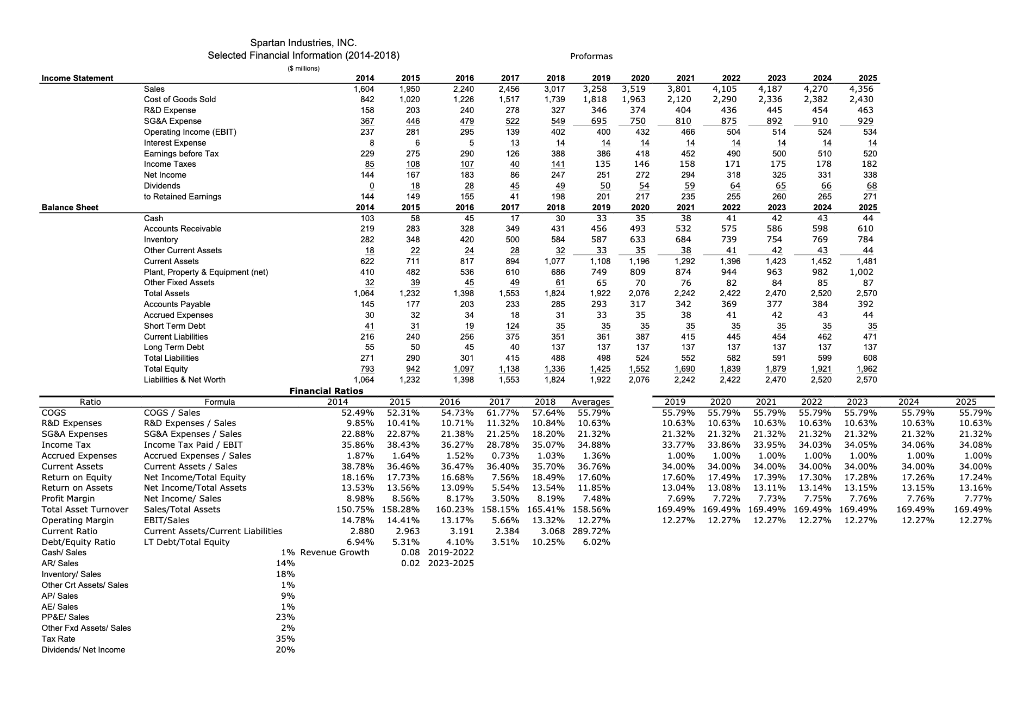

Advanced Corporate Finance Homework Assignment #3 Facts: It is 2019 Wolverine Inc. is considering making an offer to purchase Spartan Industries, Inc. ("Spartan"). You are a financial analyst working at an investment bank hired by Spartan tasked with determining a value of the company so they may evaluate the offer. You determined that Spartan requires additional capital to support the production and distribution of its second generation of products. Accordingly, you must now determine the optimal debt level Spartan can comfortably support. You are uncertain of Spartan's appropriate Coverage Ratio (h) and Cost of Capital (rd), but you are aware of the following: 1.In 2018, Spartan issued $87 million in debt with an interest rate of 6.25%; and 2.Wolverine, a direct competitor of Spartan, uses a Coverage Ratio of 2.5 Additionally, you are aware that Spartan has 50,000,000 shares outstanding with a current stock price of $58/share. Assignment: Using the historical financial information provided in the Excel file titled "HW #3 -Exhibit", and the above-provided information, calculate the following for BCI: 1. Optimal debt level; 2.Current short-and long-term debt; 3.Additional long-term debt; 4.Market value of equity; 5. Total capital; 6.Current debt: total capital ratio; 7.Current equity: total capital ratio. Instructions: Please copy the Excel file and show your work on the spreadsheet. NOTE: Proforma projections should not affect Optimal Debt level. Moreover, for debt levels round all dollar amounts to the nearest dollar and all percentages to the nearest whole percent. Profarmas Income Statement 2023 4,187 2,336 445 892 2024 4,270 2,382 454 910 2025 4,356 2,430 2017 2,456 1,517 278 522 139 13 126 240 203 446 463 929 281 514 524 534 2018 2019 2020 2021 2022 3.017 3,258 3,519 3,801 4,105 1.739 1.818 1.963 2 .120 2,290 327 346 374404436 549695750810 875 402 400432 466 504 14 14 14 14 386 490 135 146 171 272 318 49 54 59 198 201 255 2019 2020 275 290 388 418 452 510 520 100 141 158 500 175 178 182 144 183 86 247 251 294 325 331 338 45 50 66 68 155 217 235 260 271 Balance Sheet 265 2024 2014 2017 2018 2021 2022 2023 2025 349 456 493 329*8*********83****** 575 739 586 754 587 598 769 610 784 282 500 0183363822331333 SE TREE AFLA SILA 18 431 584 32 1,077 686 35 42 28 894 610 817 33 1.100 749 532 684 3B 1.292 874 76 2.242 1,423 1,481 1.193 809 70 2.078 536 1,452 982 963 1,002 32 45 49 65 1.824 1.398 944 82 2.422 369 41 2.520 2.570 Spartan Industries, INC. Selected Financial Information (2014-2018) 15 milions) 2014 2015 2016 Sales 1.604 1.950 2 240 Cost of Goods Sald 842 1.020 1.226 R&D Expense 158 SG&A Expense 367 479 Operating Income (EBIT) 237 295 Interest Expense Eamings before Tax 229 Income Taxes 107 Net Income Dividends 28 to Ratained Earnings 144 2015 2016 Cash Accounts Roonivable 219 283 328 Inventory 348 420 Other Current Assets 22 Current Assels 622 711 Plant, Property & Equipment (net) 410 482 Other Ficed Assets Total Assels 1.064 1.232 1 398 Accounts Payable 145 177 203 Accrued Expenses Short Term Debt 31 Current Liabilities 216 Long Term Debt 55 50 Total Liabilities 271 301 Total Equity 793 942 1.097 Liabilities & Net Worth 1,064 1232 1,398 Financial Ratios Formula 2014 2016 COGS/ Sales 52.49% 52.31% 54.73% R&D Expenses / Sales 9.85% 10.41% 10.71% SG&A Expenses / Sales 22.88% 22.87% 21.38% Income Tax Paid / EBIT 35.86% 38.43% 36.27% Accrued Expenses / Sales 1.87% 1.64% 1.52% Current Assets / Sales 38.78% 36.46% 36.47% Net Income/Total Equity 18.16% 17.73% 16.68% Net Income/Total Assets 13.53% 13.56% 13.09% Net Income/ Sales 8.98% 8.56% 8.17% Sales/Total Assets 150.75% 158.28% 160.23% EBIT/Sales 14.78% 14.41% 13.17% Current Assets/Current Liabilities 2.880 2.963 3.191 LT Debt/Total Equity 6.94% 5.31% 4.10% 1% Revenue Growth 0.08 2019-2022 14% 0.02 2023-2025 18% 1% 1,553 233 18 342 1.922 293 33 384 285 31 392 84 2.470 377 42 35 30 317 35 35 34 19 43 35 44 35 124 35 35 35 240 256 351 361 387 445 415 137 462 45 137 137 137 137 137 591 137 375 40 415 1,138 1,553 290 562 582 599 808 137 488 1,336 1,336 1,824 498 1,425 1,922 524 1,552 2,076 1,690 2,242 1,839 2,422 1,879 2.470 1,921 2,520 1,962 2,570 2015 2025 55.79% 2017 61.77% 11,32% 21.25% 28.78% 0.73% 36.40% 7.56% 5.54% 3.50% 158.15% 5.66% 2.384 3.51% 2018 Averages 57.64% 55,79% 10.84% 10.63% 18.20% 21.32% 35.07% 34,88% 1.03% 1.36% 35.70% 36.76% 18.49% 17.60% 13.54% 11.85% 8.19% 7.48% 165.41% 158.56% 13.32% 12.27% 3.068 289.72% 10.25% 6.02% 2019 55.79% 10.63% 21.32% 33.77% 1.00% 34.00% 17.60% 13.04% 7.69% 169.49% 12.27% 2020 55,79% 10,63% 21.32% 33.86% 1.00% 34.00% 17,49% 13.08% 7.72% 169.49% 12.27% 2021 55.79% 10.63% 21.32% 33,95% 1.00% 34.00% 17.39% 13.11% 7.73% 169.49% 12.27% 2022 55,79% 10.63% 21.32% 34.03% 1.00% 34.00% 17.30% 13.14% 7.75% 169.49% 12.27% 2023 55,79% 10.63% 21.32% 34.05% 1.00% 34.00% 17.28% 13.15% 7.76% 169.49% 12.27% Ratio COGS R&D Expenses SG&A Expenses Income Tax Accrued Expenses Current Assets Return on Equity Return on Assets Profit Margin Total Asset Turnover Operating Margin Current Ratio Debt/Equity Ratio Cash/ Sales ARI Sales Inventoryl Sales Other Crt Assets/ Sales AP/ Sales AE/ Sales PP&El Sales Other Fxd Assets/ Sales Tax Rate Dividends/ Net Income 2024 55.79% 10.63% 21.32% 34.06% 1.00% 34.00% 17.26% 13.15% 7.76% 169.49% 12.27% 10.63% 21.32% 34.08% 1.00% 34.00% 17.24% 13.16% 7.77% 169.49% 12.27% 9% 1% 23% 2% 35% 20% Advanced Corporate Finance Homework Assignment #3 Facts: It is 2019 Wolverine Inc. is considering making an offer to purchase Spartan Industries, Inc. ("Spartan"). You are a financial analyst working at an investment bank hired by Spartan tasked with determining a value of the company so they may evaluate the offer. You determined that Spartan requires additional capital to support the production and distribution of its second generation of products. Accordingly, you must now determine the optimal debt level Spartan can comfortably support. You are uncertain of Spartan's appropriate Coverage Ratio (h) and Cost of Capital (rd), but you are aware of the following: 1.In 2018, Spartan issued $87 million in debt with an interest rate of 6.25%; and 2.Wolverine, a direct competitor of Spartan, uses a Coverage Ratio of 2.5 Additionally, you are aware that Spartan has 50,000,000 shares outstanding with a current stock price of $58/share. Assignment: Using the historical financial information provided in the Excel file titled "HW #3 -Exhibit", and the above-provided information, calculate the following for BCI: 1. Optimal debt level; 2.Current short-and long-term debt; 3.Additional long-term debt; 4.Market value of equity; 5. Total capital; 6.Current debt: total capital ratio; 7.Current equity: total capital ratio. Instructions: Please copy the Excel file and show your work on the spreadsheet. NOTE: Proforma projections should not affect Optimal Debt level. Moreover, for debt levels round all dollar amounts to the nearest dollar and all percentages to the nearest whole percent. Profarmas Income Statement 2023 4,187 2,336 445 892 2024 4,270 2,382 454 910 2025 4,356 2,430 2017 2,456 1,517 278 522 139 13 126 240 203 446 463 929 281 514 524 534 2018 2019 2020 2021 2022 3.017 3,258 3,519 3,801 4,105 1.739 1.818 1.963 2 .120 2,290 327 346 374404436 549695750810 875 402 400432 466 504 14 14 14 14 386 490 135 146 171 272 318 49 54 59 198 201 255 2019 2020 275 290 388 418 452 510 520 100 141 158 500 175 178 182 144 183 86 247 251 294 325 331 338 45 50 66 68 155 217 235 260 271 Balance Sheet 265 2024 2014 2017 2018 2021 2022 2023 2025 349 456 493 329*8*********83****** 575 739 586 754 587 598 769 610 784 282 500 0183363822331333 SE TREE AFLA SILA 18 431 584 32 1,077 686 35 42 28 894 610 817 33 1.100 749 532 684 3B 1.292 874 76 2.242 1,423 1,481 1.193 809 70 2.078 536 1,452 982 963 1,002 32 45 49 65 1.824 1.398 944 82 2.422 369 41 2.520 2.570 Spartan Industries, INC. Selected Financial Information (2014-2018) 15 milions) 2014 2015 2016 Sales 1.604 1.950 2 240 Cost of Goods Sald 842 1.020 1.226 R&D Expense 158 SG&A Expense 367 479 Operating Income (EBIT) 237 295 Interest Expense Eamings before Tax 229 Income Taxes 107 Net Income Dividends 28 to Ratained Earnings 144 2015 2016 Cash Accounts Roonivable 219 283 328 Inventory 348 420 Other Current Assets 22 Current Assels 622 711 Plant, Property & Equipment (net) 410 482 Other Ficed Assets Total Assels 1.064 1.232 1 398 Accounts Payable 145 177 203 Accrued Expenses Short Term Debt 31 Current Liabilities 216 Long Term Debt 55 50 Total Liabilities 271 301 Total Equity 793 942 1.097 Liabilities & Net Worth 1,064 1232 1,398 Financial Ratios Formula 2014 2016 COGS/ Sales 52.49% 52.31% 54.73% R&D Expenses / Sales 9.85% 10.41% 10.71% SG&A Expenses / Sales 22.88% 22.87% 21.38% Income Tax Paid / EBIT 35.86% 38.43% 36.27% Accrued Expenses / Sales 1.87% 1.64% 1.52% Current Assets / Sales 38.78% 36.46% 36.47% Net Income/Total Equity 18.16% 17.73% 16.68% Net Income/Total Assets 13.53% 13.56% 13.09% Net Income/ Sales 8.98% 8.56% 8.17% Sales/Total Assets 150.75% 158.28% 160.23% EBIT/Sales 14.78% 14.41% 13.17% Current Assets/Current Liabilities 2.880 2.963 3.191 LT Debt/Total Equity 6.94% 5.31% 4.10% 1% Revenue Growth 0.08 2019-2022 14% 0.02 2023-2025 18% 1% 1,553 233 18 342 1.922 293 33 384 285 31 392 84 2.470 377 42 35 30 317 35 35 34 19 43 35 44 35 124 35 35 35 240 256 351 361 387 445 415 137 462 45 137 137 137 137 137 591 137 375 40 415 1,138 1,553 290 562 582 599 808 137 488 1,336 1,336 1,824 498 1,425 1,922 524 1,552 2,076 1,690 2,242 1,839 2,422 1,879 2.470 1,921 2,520 1,962 2,570 2015 2025 55.79% 2017 61.77% 11,32% 21.25% 28.78% 0.73% 36.40% 7.56% 5.54% 3.50% 158.15% 5.66% 2.384 3.51% 2018 Averages 57.64% 55,79% 10.84% 10.63% 18.20% 21.32% 35.07% 34,88% 1.03% 1.36% 35.70% 36.76% 18.49% 17.60% 13.54% 11.85% 8.19% 7.48% 165.41% 158.56% 13.32% 12.27% 3.068 289.72% 10.25% 6.02% 2019 55.79% 10.63% 21.32% 33.77% 1.00% 34.00% 17.60% 13.04% 7.69% 169.49% 12.27% 2020 55,79% 10,63% 21.32% 33.86% 1.00% 34.00% 17,49% 13.08% 7.72% 169.49% 12.27% 2021 55.79% 10.63% 21.32% 33,95% 1.00% 34.00% 17.39% 13.11% 7.73% 169.49% 12.27% 2022 55,79% 10.63% 21.32% 34.03% 1.00% 34.00% 17.30% 13.14% 7.75% 169.49% 12.27% 2023 55,79% 10.63% 21.32% 34.05% 1.00% 34.00% 17.28% 13.15% 7.76% 169.49% 12.27% Ratio COGS R&D Expenses SG&A Expenses Income Tax Accrued Expenses Current Assets Return on Equity Return on Assets Profit Margin Total Asset Turnover Operating Margin Current Ratio Debt/Equity Ratio Cash/ Sales ARI Sales Inventoryl Sales Other Crt Assets/ Sales AP/ Sales AE/ Sales PP&El Sales Other Fxd Assets/ Sales Tax Rate Dividends/ Net Income 2024 55.79% 10.63% 21.32% 34.06% 1.00% 34.00% 17.26% 13.15% 7.76% 169.49% 12.27% 10.63% 21.32% 34.08% 1.00% 34.00% 17.24% 13.16% 7.77% 169.49% 12.27% 9% 1% 23% 2% 35% 20%


