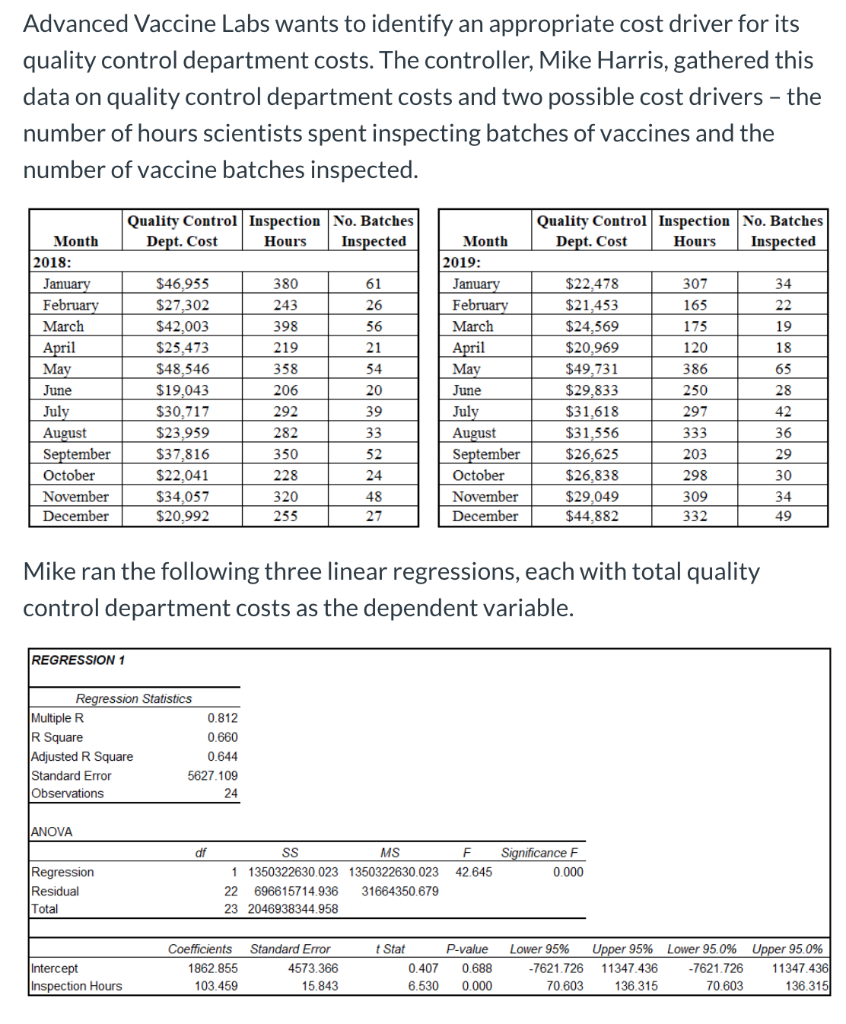
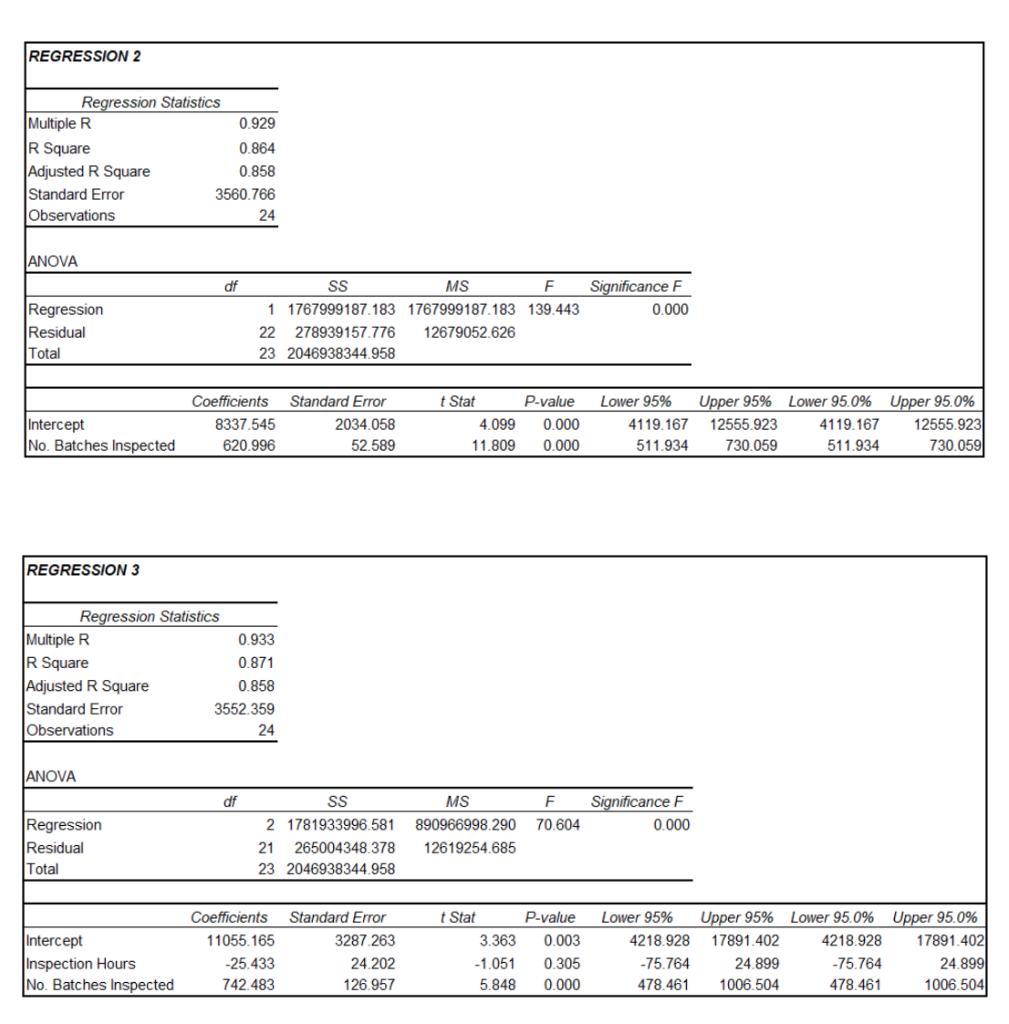
Advanced Vaccine Labs wants to identify an appropriate cost driver for its quality control department costs. The controller, Mike Harris, gathered this data on quality control department costs and two possible cost drivers - the number of hours scientists spent inspecting batches of vaccines and the number of vaccine batches inspected. Quality Control Inspection No. Batches Dept. Cost Hours Inspected Quality Control Inspection No. Batches Dept. Cost Hours Inspected Month 2019: January February March 34 307 165 175 April 120 Month 2018: January February March April May June July August September October November December $46,955 $27,302 $42,003 $25,473 $48,546 $19,043 $30,717 $23.959 $37,816 $22,041 $34,057 $20,992 380 243 398 219 358 206 292 282 350 228 320 255 May June July August September October November December $22,478 $21,453 $24,569 $20,969 $49,731 $29,833 $31,618 $31,556 $26,625 $26,838 $29,049 $44,882 203 27 1 332 Mike ran the following three linear regressions, each with total quality control department costs as the dependent variable. REGRESSION 1 0.812 Regression Statistics Multiple R R Square 0.660 Adjusted R Square 0.644 Standard Error 5627.109 Observations ANOVA MS F 1 1350322630.023 1350322630.023 22 696615714.936 31664350.679 23 2046938344.958 Significance F 0.000 Regression Residual Total 42.645 t Intercept Inspection Hours Coefficients 1862.855 103.459 Standard Error 4573.366 15.843 Stat 0.407 6.530 P-value 0.688 0.000 Lower 95% -7621.726 7 0.603 Upper 95% 11347.436 136.315 Lower 95.0% -7621.726 70.603 Upper 95.0% 11347,436 136.315 REGRESSION 2 Regression Statistics Multiple R 0.929 R Square 0.864 Adjusted R Square 0.858 Standard Error 3560.766 Observations ANOVA df SS MS F 1 1767999187.183 1767999187.183 139.443 22 278939157.776 12679052.626 23 2046938344.958 Significance F 0.000 Regression Residual Total t Intercept INo. Batches Inspected Coefficients 8337,545 620.996 Standard Error 2 034.058 5 2.589 Stat 4.099 11.809 P-value 0.000 0.000 Lower 95% 4 119.167 5 11.934 Upper 95% 12555.923 730.059 Lower 95.0% 4119.167 511.934 Upper 95.0% 12555.923 730 059 REGRESSION 3 Regression Statistics Multiple R 0.933 R Square 0.871 Adjusted R Square 0.858 Standard Error 3552.359 Observations 24 ANOVA df SS 2 1781933996.581 21 265004348.378 23 2046938344.958 MS F 890966998.290 12619254.685 Regression Residual Total 70.604 Significance F 0.000 Intercept Inspection Hours No. Batches Inspected Coefficients 11055.165 -25.433 742.483 Standard Error 3287.263 24.202 126.957 Stat P-value 3.363 0.003 -1.0510.305 5.848 0.000 Lower 95% 4218.928 -75.764 478.461 Upper 95% 17891.402 24.899 1006.504 Lower 95.0% Upper 95.0% 4218.928 17891.402 -75.764 24.899 478.461 1006.504 Refer to Regression 2. What is the general form of a regression model such as this one? O Y = 8337.545 + (620.996 X1) O None of the answers provided are correct. O Y = intercept + ( B1X1) + E O Y = Bo +(B1X1) + E O Y = (B1X1)+ E